

- お役立ち記事
- Developing Competitive Products Using Patent Maps for Strategic Advantage

Developing Competitive Products Using Patent Maps for Strategic Advantage

目次
Understanding Patent Maps
Patent maps are visual representations that organize and display information from patents.
They play a crucial role in understanding technological landscapes and can highlight areas of development across various industries.
By using graphical and statistical data, patent maps help businesses and researchers grasp the competitive environment.
These maps are tools that aid in identifying trends, discovering gaps in research, and determining potential opportunities for innovation.
Through this visual representation, companies can better assess where to focus their development efforts and how to strategically position their products.
Patent maps serve as a guide for navigating complex patent information, which can be overwhelming without the proper tools.
The Strategic Advantage of Patent Maps
Using patent maps allows businesses to gain a strategic advantage by supporting informed decision-making processes.
By visualizing patent data, organizations can efficiently analyze the competitive landscape and strategically shape their research and development (R&D) efforts.
This analysis helps identify potential partners or competitors, recognize open areas for innovation, and understand the intensity of patent activity within a particular domain.
Additionally, patent maps can help companies avoid legal disputes by clarifying existing patents and minimizing the risk of infringement.
With insights derived from these maps, businesses can create products that are more competitive and better aligned with market needs.
Identifying Technological Trends
One of the key benefits of patent maps is their ability to highlight technological trends.
By examining how technology has evolved over time, businesses can identify patterns and predict the direction of future advancements.
This foresight can be particularly valuable in fast-paced industries where staying ahead of the curve is critical.
For example, a company might use patent maps to observe an increase in patents related to renewable energy, indicating a growing trend in that field.
In turn, this data can inform strategic investment decisions and encourage the development of innovative renewable energy solutions.
Finding Gaps in the Market
Patent maps not only reveal trends but also expose gaps in the market.
These gaps represent opportunities for businesses to innovate and create new products or services that fulfill unmet needs.
By analyzing patent data, companies can pinpoint areas with minimal patent activity, which could indicate less competition and more potential for growth.
This insight allows businesses to focus their efforts on niche markets or technologies that are ripe for development, thereby gaining a competitive edge.
For instance, a company might find that there is little patent activity in a specific aspect of wearables technology, presenting an opportunity to develop a new product line.
Navigating the Patent Landscape
Navigating the patent landscape is a complex task made easier with the help of patent maps.
These tools provide clarity and structure to what can often be a daunting aggregation of data.
By understanding the current patent landscape, businesses can make tactical decisions, such as choosing to file a new patent or licensing an existing one.
Furthermore, these maps can aid in determining the relative strength of a competitor’s patent portfolio, providing insights into potential challenges and opportunities.
This information can be instrumental in shaping a company’s IP strategy and ensuring that their innovations are well-protected.
Practical Applications of Patent Maps
Patent maps are useful across various industries, from technology and pharmaceuticals to automotive and consumer goods.
Their ability to distill complex data into accessible visuals makes them invaluable tools for R&D departments, strategic planners, and business executives.
In conclusion, developing competitive products in today’s fast-paced market requires a deep understanding of the technological landscape. Patent maps offer this understanding by transforming complex patent data into actionable insights. They provide strategic advantages by identifying trends, exposing gaps, and helping navigate the patent landscape, enabling businesses to make informed decisions. With the help of patent maps, companies can strategically position their products, drive innovation, and maintain a competitive edge in their respective industries. As such, integrating the use of patent maps into business strategies is an essential step toward staying ahead in the dynamic world of technology and innovation. この記事の理解を深める 製造業の現場で使える実務資料(PDF)を無料でお届けします。"こんな資料が届きます" ↓ 下のボタンからどうぞ。
無料ホワイトペーパーをプレゼント
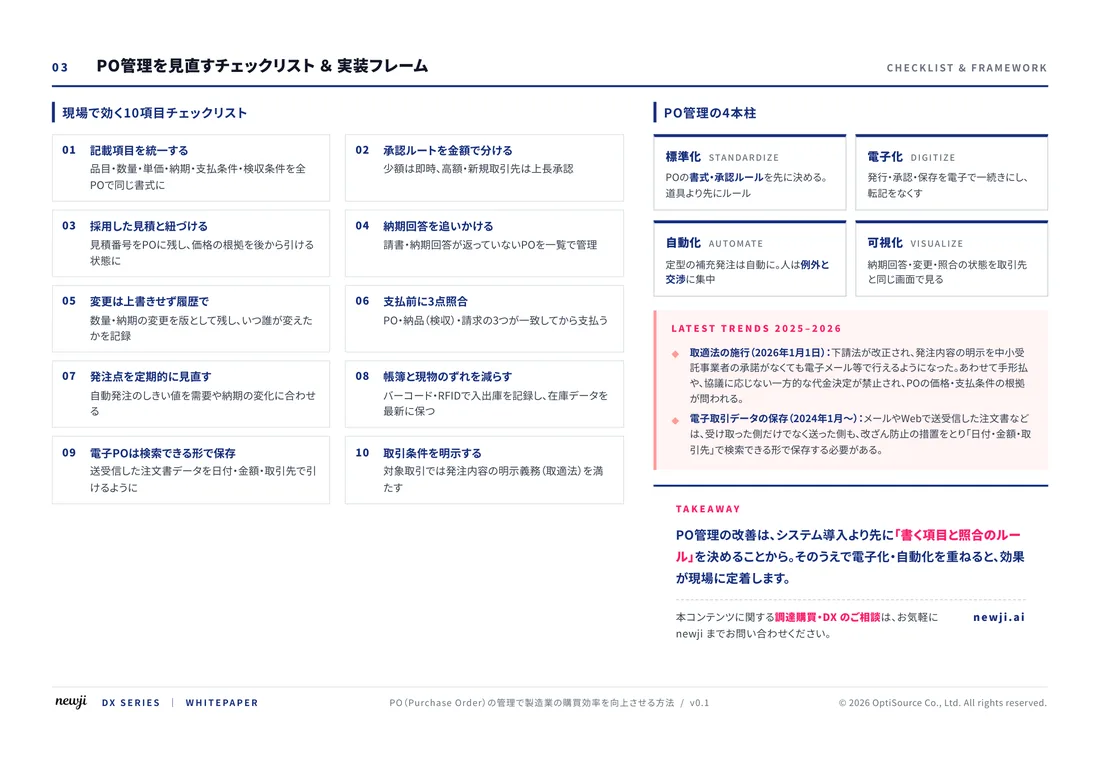
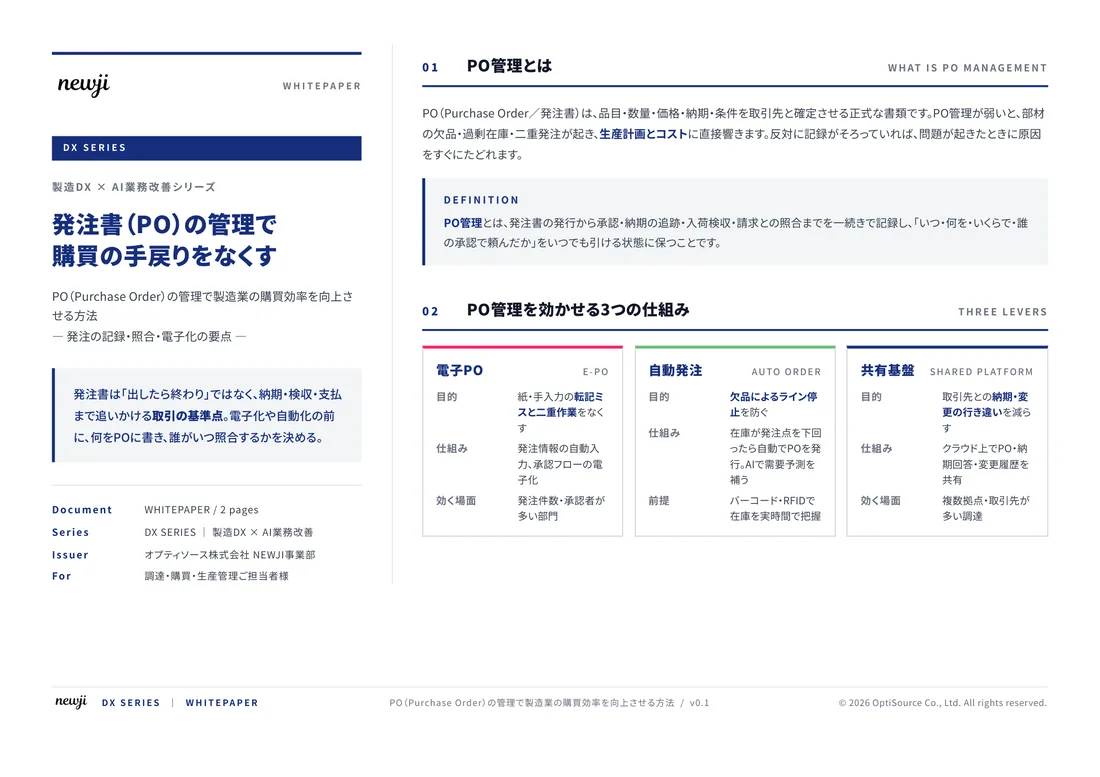
FREE DOCUMENT — サービス資料(PDF・無料)
製造業の見積・受発注クラウド
「Newji one」とは
Newji one は、製造業の調達・受発注に特化したクラウド/AIエージェント。見積依頼・発注書作成・進捗管理・承認をひとつの画面に集約し、AIが比較と異常検知を担当。最後の「GO」だけ人が押す仕組みです。
▶ 製造業の見積・受発注クラウド「Newji one」を、資料で見る(PDF・無料)
- 見積〜発注〜納期を一元管理。催促・転記のムダをゼロに
- AIが相見積もり比較と異常検知。あなたは判断だけに集中
- 取引先は「招待」で完全無料。自社コストだけで取引先ごとデジタル化
※ 取引先から招待された企業様は完全無料でご利用いただけます

 NEWJI総研
 OEM/ODM 生産委託
 AI/DX支援
 見積・発注クラウド Newji one
受発注が増えるほど、入力・確認・催促が重くなる。
受発注管理を“仕組み化“して、ミスと工数を削減しませんか。
見積・発注・納期まで一元管理できます。