

- お役立ち記事
- Key points for visualization of project process management and schedule compliance management

Key points for visualization of project process management and schedule compliance management

目次
Introduction to Project Process Visualization
In today’s fast-paced business environment, organizations are constantly seeking ways to improve efficiency and productivity.
One effective approach to achieve these goals is through the visualization of project process management.
This method not only enhances team collaboration but also provides a clear overview of progress, enabling timely decision-making.
Understanding the key points for visualization can significantly impact the successful completion of projects.
This article will delve into the essential aspects of project process visualization and its role in schedule compliance management.
Why Visualization is Crucial in Project Management
Visualization in project management involves the use of charts, graphs, and other visual tools to display critical information about a project’s status and progress.
The primary advantage of visualization is that it transforms complex data into accessible and easily digestible formats.
This capability allows team members and stakeholders to quickly understand the project’s current state and future trajectory.
With the increasing complexity of projects, traditional management methods may fall short.
Visualization helps bridge this gap by offering comprehensive insights into different project components.
This clarity facilitates better communication and transparency within the team, which is critical for the seamless execution of tasks.
Key Elements of Project Process Visualization
1. Gantt Charts
Gantt charts are one of the most popular visualization tools in project management.
They provide a bar chart representation of a project schedule, highlighting task durations, start and end dates, and dependencies between tasks.
By visualizing the entire timeline, project managers can easily identify potential bottlenecks and adjust plans accordingly.
2. Kanban Boards
Kanban boards offer a visual representation of workflow and task status.
They are particularly useful in agile project management, facilitating continuous delivery and improvement.
By organizing tasks into columns such as “To Do,” “In Progress,” and “Done,” teams can quickly assess their progress and identify areas that require attention.
3. Flowcharts
Flowcharts map out each step of a project process, providing a visual sequence of actions and decisions.
They are instrumental in understanding how tasks are interrelated and ensuring that each team member knows their responsibilities.
This clarity helps in minimizing errors and streamlining the workflow.
4. Dashboards
Dashboards integrate multiple data sources into a single visual display, offering a holistic view of project performance.
They can include key performance indicators (KPIs), financial metrics, and other relevant data to assess project health.
Real-time dashboards allow managers to make informed decisions and adjust strategies when necessary.
Role of Visualization in Schedule Compliance Management
Schedule compliance management is the practice of ensuring that project tasks are completed within the agreed timelines.
Visualization plays a pivotal role in this area by providing clear insights into task progress and potential delays.
1. Identifying Critical Paths
Critical path analysis identifies the sequence of dependent tasks that determine the project’s minimum completion time.
Using visualization tools to map out these paths helps project managers focus on crucial tasks that could impact the overall schedule.
2. Monitoring Milestones
Project milestones are key checkpoints that signify the completion of major phases.
Visualizing these milestones allows teams to track their progress against scheduled dates.
If milestones are not met, managers can investigate the underlying issues and take corrective actions to stay on track.
3. Resource Allocation
Visualization aids in effective resource allocation by mapping resources to tasks and timelines.
By understanding resource availability and workload distribution, managers can optimize productivity and prevent overextension.
This strategic allocation is essential for maintaining schedule compliance.
Best Practices for Effective Project Visualization
Implementing visualization in project process management requires practical strategies to enhance its effectiveness.
1. Keep It Simple
When designing visual tools, simplicity is key.
Avoid cluttered and overly complex charts that can overwhelm the audience.
Use clear labels, legends, and consistent color schemes to ensure readability and comprehension.
2. Customize for Your Audience
Tailor visualizations to meet the needs of different stakeholders.
Executives may require high-level dashboards, whereas team members might need more detailed charts for day-to-day management.
Consider your audience’s preferences and adjust visuals accordingly.
3. Update Regularly
Regular updates ensure that visualizations reflect the current state of the project.
Automate data feeds where possible to minimize manual updates and keep information accurate and timely.
This practice is vital for maintaining trust and making informed decisions.
Conclusion
The visualization of project process management and schedule compliance is an invaluable strategy for organizations seeking to enhance their efficiency and effectiveness.
By leveraging visual tools like Gantt charts, Kanban boards, flowcharts, and dashboards, teams can gain critical insights into their projects’ development.
Through careful implementation of visualization practices, project managers can ensure timely task execution, resource optimization, and improved communication among stakeholders.
Ultimately, embracing visualization as part of project management can lead to successful project delivery and achievement of organizational goals.
この記事の理解を深める
無料ホワイトペーパーをプレゼント
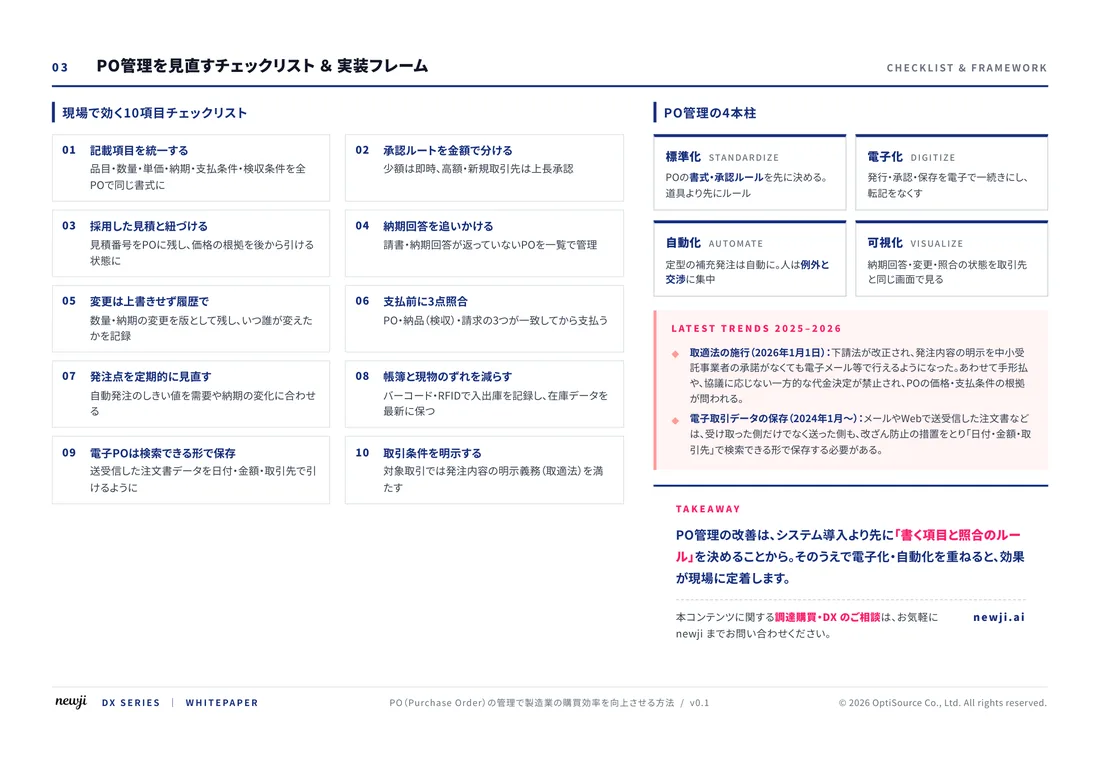
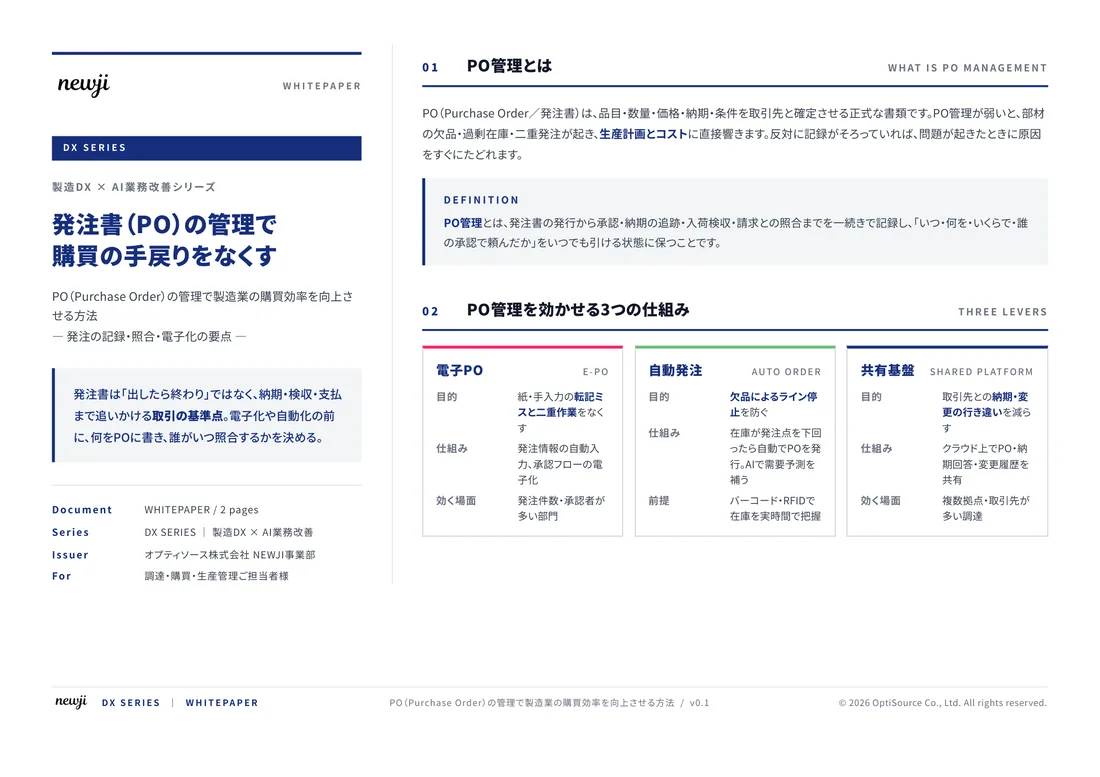
製造業の現場で使える実務資料(PDF)を無料でお届けします。"こんな資料が届きます" ↓ 下のボタンからどうぞ。
FREE DOCUMENT — サービス資料(PDF・無料)
製造業の見積・受発注クラウド
「Newji one」とは
Newji one は、製造業の調達・受発注に特化したクラウド/AIエージェント。見積依頼・発注書作成・進捗管理・承認をひとつの画面に集約し、AIが比較と異常検知を担当。最後の「GO」だけ人が押す仕組みです。
▶ 製造業の見積・受発注クラウド「Newji one」を、資料で見る(PDF・無料)
- 見積〜発注〜納期を一元管理。催促・転記のムダをゼロに
- AIが相見積もり比較と異常検知。あなたは判断だけに集中
- 取引先は「招待」で完全無料。自社コストだけで取引先ごとデジタル化
※ 取引先から招待された企業様は完全無料でご利用いただけます


 NEWJI総研
 OEM/ODM 生産委託
 AI/DX支援
 見積・発注クラウド Newji one
受発注が増えるほど、入力・確認・催促が重くなる。
受発注管理を“仕組み化“して、ミスと工数を削減しませんか。
見積・発注・納期まで一元管理できます。