

- お役立ち記事
- Basics and key points of time series data analysis using Python

Basics and key points of time series data analysis using Python

Time series data analysis is a crucial skill for many professionals working with data, allowing them to analyze data points collected or recorded at successive points in time.
This could range from daily stock prices, annual rainfall measurements, or even hourly server logs.
Python, with its extensive ecosystem of libraries, offers powerful tools for time series analysis.
Understanding these basics and key points will aid you in effectively managing and interpreting time series data.
目次
Understanding Time Series Data
At its simplest, time series data is a sequence of data points collected at consistent intervals over time.
These data points are often indexed by timestamps, which could be exact times, dates, or even years, depending on the data’s granularity.
The primary objective of time series analysis is to identify meaningful characteristics and patterns in the data.
It includes analyzing trends, seasonality, cyclical patterns, and irregular variations.
Components of Time Series Data
1. **Trend:** This refers to the long-term movement in a time series.
It can be upward, downward, or constant, indicating growth or decline over time.
2. **Seasonality:** Seasonal variations are patterns that repeat at regular intervals due to seasonal factors.
For example, retail sales often increase during holidays.
3. **Cyclical Patterns:** Unlike seasonality, cycles don’t occur at regular intervals and are often longer-term fluctuations.
Economic expansions and recessions are good examples of cyclical patterns.
4. **Irregular Variations:** These are random or unpredictable events that cause fluctuations in time series data, such as natural disasters or unforeseen events.
Python Libraries for Time Series Analysis
Python simplifies time series analysis with its robust libraries.
Some essential libraries include:
Pandas
Pandas is a highly versatile library designed for data manipulation and analysis.
It provides powerful tools to handle time series data, such as datetime indexing, resampling, and missing data handling.
NumPy
NumPy is crucial for numerical computation and handling multi-dimensional arrays.
It complements Pandas by providing mathematical functions to operate on time series data efficiently.
Matplotlib and Seaborn
These are visualization libraries that help to plot time series data.
Visualizations like line plots, bar charts, and histograms are helpful in identifying trends and patterns easily.
Statsmodels
Statsmodels is vital for statistical modeling and hypothesis testing.
It offers tools for fitting statistical models, performing tests, and more, making it ideal for time series forecasting.
Scikit-learn
Though primarily a machine learning library, Scikit-learn contains essential tools for time series analysis, such as regression models that can be used for prediction purposes.
Key Steps in Time Series Analysis Using Python
Loading and Inspecting Data
The first step involves loading your dataset and inspecting it.
Use the Pandas library to read your data into a DataFrame and understand its structure.
“`python
import pandas as pd
df = pd.read_csv(‘your_data.csv’, parse_dates=[‘date_column’])
df.head()
“`
This step includes checking for basic information such as data types, missing values, and preliminary statistics.
Time Series Decomposition
Decomposition is a technique used to break down a time series into its components: trend, seasonality, and residuals (irregularities).
This can be achieved using the Statsmodels library.
“`python
from statsmodels.tsa.seasonal import seasonal_decompose
decomposition = seasonal_decompose(df[‘target_column’], model=’additive’)
decomposition.plot()
“`
Handling Missing Values
Missing data is common in time series datasets.
Using Pandas, you can choose methods like forward fill, backward fill, or interpolation to handle these gaps.
“`python
df.fillna(method=’ffill’, inplace=True) # Forward fill
“`
Resampling
Resampling is about converting your time series data frequency.
For example, converting daily data to monthly data, which can help in reducing noise and focusing on the overall trend.
“`python
monthly_data = df.resample(‘M’).mean()
“`
Visualizing Data
Visualization is crucial for uncovering patterns and insights.
Use Matplotlib or Seaborn to create plots that represent the data clearly.
“`python
import matplotlib.pyplot as plt
plt.figure(figsize=(10, 5))
plt.plot(df[‘date_column’], df[‘target_column’])
plt.title(‘Time Series Plot’)
plt.show()
“`
Time Series Forecasting
Once the data is explored and preprocessed, you can proceed to forecasting.
Simple methods include moving averages and exponential smoothing.
Advanced models include ARIMA, SARIMA, and Prophet that can help deal with both trend and seasonality.
“`python
from statsmodels.tsa.arima_model import ARIMA
model = ARIMA(df[‘target_column’], order=(1, 1, 1))
model_fit = model.fit(disp=0)
print(model_fit.summary())
“`
Conclusion
Time series analysis using Python is a powerful method to understand past behaviors and to predict future values.
By understanding its components and leveraging Python’s extensive libraries, you can handle time series data effectively.
Remember, the key steps involve loading and inspecting data, decomposing the series, handling missing values, resampling, visualizing, and finally forecasting.
With these foundations, you’re well-equipped to delve deeper into time series analysis and apply it to real-world problems.
この記事の理解を深める
無料ホワイトペーパーをプレゼント
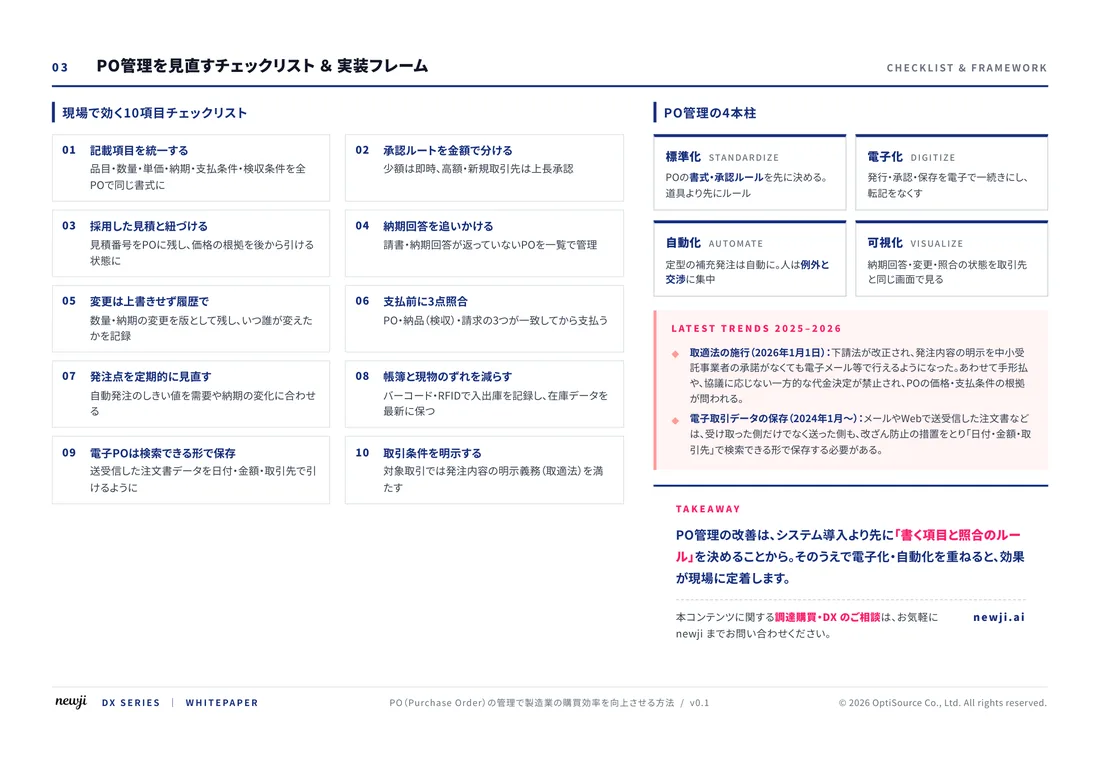
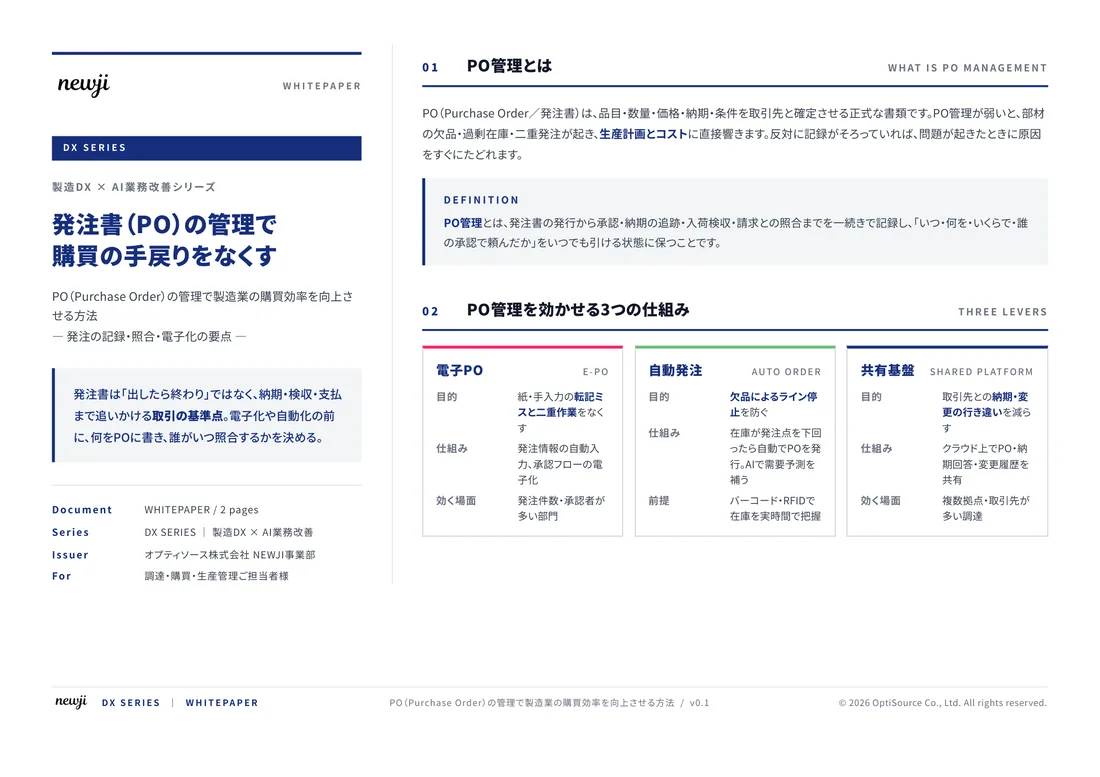
製造業の現場で使える実務資料(PDF)を無料でお届けします。"こんな資料が届きます" ↓ 下のボタンからどうぞ。
FREE DOCUMENT — サービス資料(PDF・無料)
製造業の見積・受発注クラウド
「Newji one」とは
Newji one は、製造業の調達・受発注に特化したクラウド/AIエージェント。見積依頼・発注書作成・進捗管理・承認をひとつの画面に集約し、AIが比較と異常検知を担当。最後の「GO」だけ人が押す仕組みです。
▶ 製造業の見積・受発注クラウド「Newji one」を、資料で見る(PDF・無料)
- 見積〜発注〜納期を一元管理。催促・転記のムダをゼロに
- AIが相見積もり比較と異常検知。あなたは判断だけに集中
- 取引先は「招待」で完全無料。自社コストだけで取引先ごとデジタル化
※ 取引先から招待された企業様は完全無料でご利用いただけます


 NEWJI総研
 OEM/ODM 生産委託
 AI/DX支援
 見積・発注クラウド Newji one
受発注が増えるほど、入力・確認・催促が重くなる。
受発注管理を“仕組み化“して、ミスと工数を削減しませんか。
見積・発注・納期まで一元管理できます。