

- お役立ち記事
- Fundamentals of time series analysis and applications and examples for nonlinear system prediction and diagnosis

Fundamentals of time series analysis and applications and examples for nonlinear system prediction and diagnosis

目次
Understanding Time Series Analysis
Time series analysis is a crucial aspect of data science, focusing on analyzing data points collected or recorded at specific time intervals.
This powerful tool helps in understanding underlying patterns, making future forecasts, and making informed decisions based on historical data.
Whether you are a business analyst, researcher, or a student, having a grasp of time series analysis can prove very beneficial.
A time series can be anything from daily temperatures to stock prices or even a company’s quarterly revenue.
The goal is to track the data over time to detect changes and make predictions about future values.
Components of Time Series Analysis
To effectively analyze time series data, one needs to understand its primary components:
1. **Trend**:
A trend is a long-term movement in a time series.
It represents a persistent upward or downward direction over time.
Understanding the trend helps in identifying underlying patterns and making future forecasts.
2. **Seasonality**:
Seasonality refers to recurring patterns or cycles in a time series.
These patterns often occur at regular intervals throughout the year, influenced by external factors like weather or holiday seasons.
3. **Cyclic Patterns**:
Unlike seasonality, cyclic patterns are not seasonal but occur at irregular intervals.
They often last for multiple years and are usually tied to economic or business cycles.
4. **Random Variations**:
Also known as noise, random variations are unpredictable fluctuations in the time series data.
These variations are not explained by trend, seasonality, or cyclic patterns and are often due to external factors.
Applications of Time Series Analysis
Time series analysis has numerous applications across different fields:
1. Weather Forecasting
Meteorologists use time series analysis to predict weather patterns by examining historical weather data.
This information is crucial for preparing for natural disasters, planning agricultural activities, and more.
2. Economic Forecasting
Economists employ time series analysis to understand economic trends over periods, such as inflation rates, unemployment rates, and GDP growth.
These forecasts are essential for policymakers, governments, and businesses to make informed decisions.
3. Stock Market Analysis
Investors and traders use time series analysis to forecast future stock prices and market trends.
By analyzing historical stock prices, they can identify patterns and make informed decisions about buying or selling stocks.
4. Business Planning
Businesses use time series analysis for demand forecasting, inventory management, and sales forecasting.
This helps companies optimize their operations and ensure they meet customer demands efficiently.
5. Healthcare and Medical Research
In healthcare, time series analysis is often used to track patients’ vital signs over time, predict disease outbreaks, and monitor treatment effectiveness.
Medical researchers use it to analyze the progression of diseases and evaluate the impact of interventions.
Nonlinear System Prediction and Diagnosis
While time series analysis is powerful, many real-world systems are nonlinear, meaning they do not follow a straight-line path.
For these systems, advanced techniques are required to make accurate predictions and diagnoses.
Linear vs. Nonlinear Systems
In linear systems, changes in input lead to proportional changes in output.
However, in nonlinear systems, this relationship is more complex.
For instance, in climate modeling, a small change in one factor can lead to a significant impact, illustrating the nonlinear nature of the system.
Techniques for Nonlinear Time Series Analysis
1. **Machine Learning**:
Machine learning algorithms such as neural networks and support vector machines are often used to model nonlinear time series data.
These methods are capable of learning from historical data and making accurate predictions without explicitly defining relationships.
2. **Chaos Theory**:
Chaos theory deals with complex systems that appear random but have underlying deterministic laws.
By understanding the chaotic nature of a system, predictions can be made about its future behavior.
3. **Wavelet Transform**:
Wavelet transform is a mathematical technique used to detect patterns in nonlinear time series data.
It helps in analyzing non-stationary signals by decomposing the time series into components at various scales.
Applications of Nonlinear Time Series Analysis
1. **Engineering**:
Engineers use nonlinear time series analysis to monitor and diagnose faults in machinery, ensuring timely maintenance and preventing breakdowns.
2. **Finance**:
In finance, nonlinear models help in assessing risk, predicting market crashes, and managing investment portfolios.
3. **Environmental Science**:
Scientists study complex environmental systems using nonlinear analysis to predict changes in ecosystems and understand climate dynamics.
4. **Medicine**:
In medical research, nonlinear time series analysis is used to model complex biological systems, aiding in disease prediction and patient monitoring.
Conclusion
Understanding time series analysis and its applications in nonlinear systems is crucial for anyone dealing with data collected over time.
From predicting stock markets to diagnosing machinery faults, the techniques used in time series analysis can offer valuable insights.
As technology and methodologies continue to advance, the potential for time series analysis to provide even deeper insights into complex systems will only continue to grow.
この記事の理解を深める
無料ホワイトペーパーをプレゼント
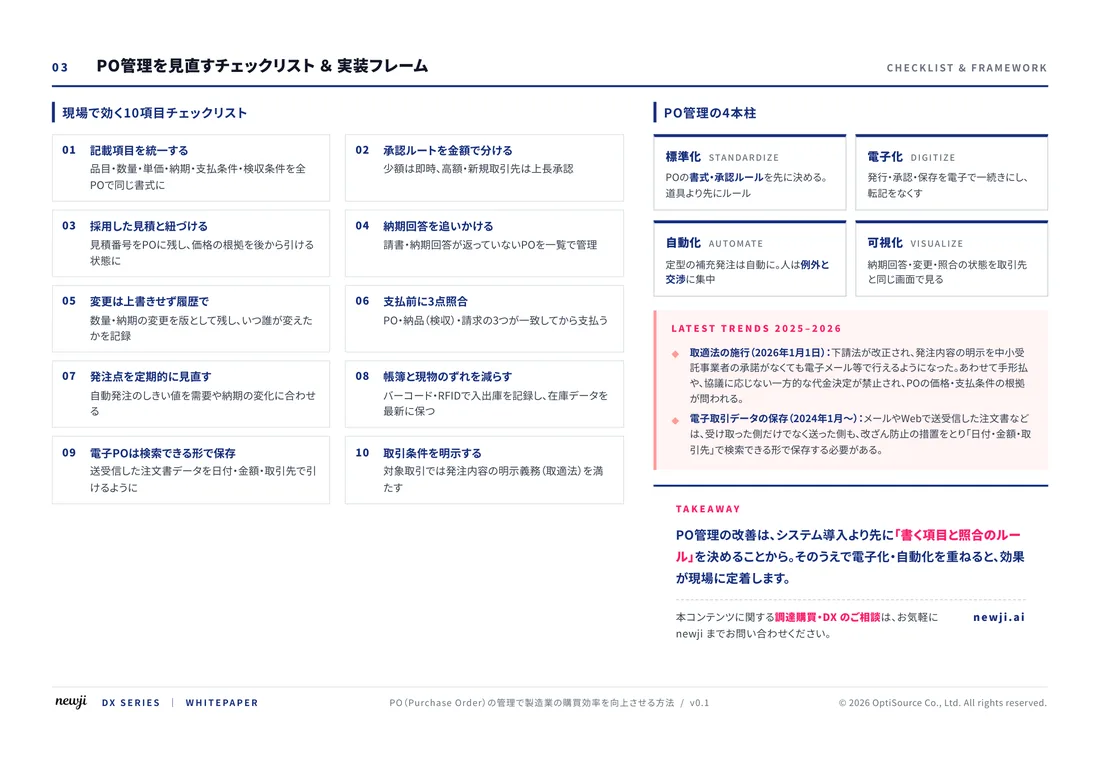
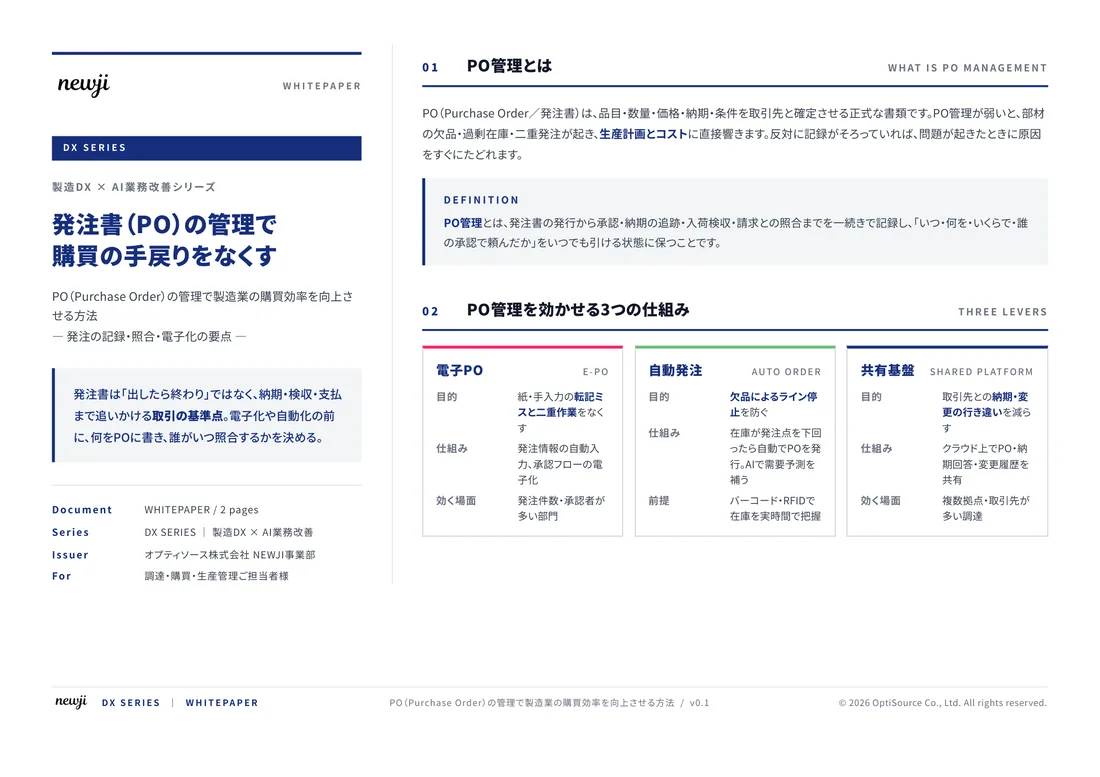
製造業の現場で使える実務資料(PDF)を無料でお届けします。"こんな資料が届きます" ↓ 下のボタンからどうぞ。
FREE DOCUMENT — サービス資料(PDF・無料)
製造業の見積・受発注クラウド
「Newji one」とは
Newji one は、製造業の調達・受発注に特化したクラウド/AIエージェント。見積依頼・発注書作成・進捗管理・承認をひとつの画面に集約し、AIが比較と異常検知を担当。最後の「GO」だけ人が押す仕組みです。
▶ 製造業の見積・受発注クラウド「Newji one」を、資料で見る(PDF・無料)
- 見積〜発注〜納期を一元管理。催促・転記のムダをゼロに
- AIが相見積もり比較と異常検知。あなたは判断だけに集中
- 取引先は「招待」で完全無料。自社コストだけで取引先ごとデジタル化
※ 取引先から招待された企業様は完全無料でご利用いただけます

 NEWJI総研
 OEM/ODM 生産委託
 AI/DX支援
 見積・発注クラウド Newji one
受発注が増えるほど、入力・確認・催促が重くなる。
受発注管理を“仕組み化“して、ミスと工数を削減しませんか。
見積・発注・納期まで一元管理できます。