

- お役立ち記事
- Fundamentals of time series data analysis and machine learning models and applications to prediction, identification, and anomaly detection

Fundamentals of time series data analysis and machine learning models and applications to prediction, identification, and anomaly detection

目次
Understanding Time Series Data
Time series data is a sequence of data points collected over time at consistent intervals.
This type of data is everywhere, from daily stock prices and weather reports to heart rate monitoring and sales forecasting.
Unlike other data types, time series data is ordered chronologically, making the sequence of observations particularly important for analysis.
Understanding this data involves recognizing trends, seasonal patterns, and potential irregularities.
Trends may reveal whether data values increase or decrease over time.
Seasonal patterns illustrate periodic fluctuations that recur at regular intervals, like weekly, monthly, or yearly.
Irregularities, or random variations, represent fluctuations that do not follow a predictable pattern.
Stationarity and Differencing
A crucial concept in analyzing time series data is stationarity.
A time series is stationary when its properties, such as mean and variance, are constant over time.
Most statistical forecasting methods require the data to be stationary.
If the data is not stationary, transformations like differencing are used to stabilize the mean across the series.
Differencing involves subtracting the previous observation from the current one to eliminate trends and seasonality.
This transforms the series into a form more suitable for modeling.
Additional techniques, like logarithmic or seasonal differencing, may also be applied depending on the data characteristics.
Machine Learning Models for Time Series
Machine learning provides robust tools for analyzing and predicting time series data.
These models can capture complex patterns that traditional statistical models might miss.
Common machine learning techniques for time series include ARIMA, LSTM, and SARIMA models.
ARIMA Model
The Autoregressive Integrated Moving Average (ARIMA) model is a powerful tool for analyzing and forecasting stationary time series.
It incorporates three components: autoregression (AR), differencing (I), and moving average (MA).
The AR part involves regressing on previous values, while the MA part models the error term as a linear combination of error terms.
Differencing ensures that the time series is stationary.
ARIMA is versatile and can be extended to seasonal periods with the SARIMA model, incorporating seasonal differencing within the same framework.
LSTM Networks
Long Short-Term Memory (LSTM) networks are a type of recurrent neural network capable of learning long-term dependencies in data.
They are especially effective for time series with long sequence patterns, allowing the model to remember values over time.
LSTMs maintain memory cells that can store information, decide what to forget, and determine what information to output.
This makes them ideal for complex time series data with varying intervals and dependencies, such as stock prices.
Applications in Prediction
Predicting future values of a dataset is a primary application of time series analysis.
Businesses use these predictions for tasks such as sales forecasting, inventory management, and financial planning.
Machine learning algorithms can significantly enhance prediction accuracy by identifying subtle patterns and relationships in the data.
Prediction models are trained on historical data, identifying the relationships and trends within the series.
This trained model is then used to forecast future values.
The accuracy of these predictions hinges on the model’s ability to capture underlying trends and seasonality.
Identification and Anomaly Detection
Identifying patterns and detecting anomalies are also essential applications of time series analysis.
In many industries, spotting anomalies is crucial for maintaining operational efficiency and security.
Anomalies may signal unusual events, indicating a need for further investigation or immediate action.
Anomaly Detection Techniques
There are several techniques for detecting anomalies in time series data.
Statistical methods involve analyzing the distribution and structure of the data to identify values that deviate significantly from the norm.
Machine learning approaches, like clustering and classification algorithms, can automatically identify outliers based on learned patterns.
Neural networks, such as autoencoders, can also be used to detect anomalies by learning to reconstruct normal data patterns and identifying deviations as anomalies.
Application Examples
In finance, anomaly detection can help identify fraudulent transactions by detecting deviation from typical spending patterns.
In manufacturing, it can be used for predictive maintenance by recognizing deviations in machinery performance to prevent potential failures.
In healthcare, monitoring patient data for unusual patterns can help in early disease detection or alert to potential health risks.
Challenges in Time Series Analysis
Despite its powerful applications, working with time series data presents challenges.
Data can be affected by external factors, missing values, and noise, complicating the analysis.
Handling seasonality and trend changes require careful model adjustments.
Data preprocessing is critical to address these challenges, involving steps like handling missing values, noise reduction, and normalization.
Choosing the right model and parameters is often a trial and error process, requiring iterative testing and evaluation.
Conclusion
Time series data analysis and machine learning models provide valuable tools for prediction, identification, and anomaly detection.
Understanding the basic principles and applications of these models can significantly enhance decision-making processes across various fields.
Despite the challenges, advancements in machine learning continue to improve the accuracy and efficiency of time series analysis.
This makes it an indispensable part of modern data science and business strategy.
この記事の理解を深める
無料ホワイトペーパーをプレゼント
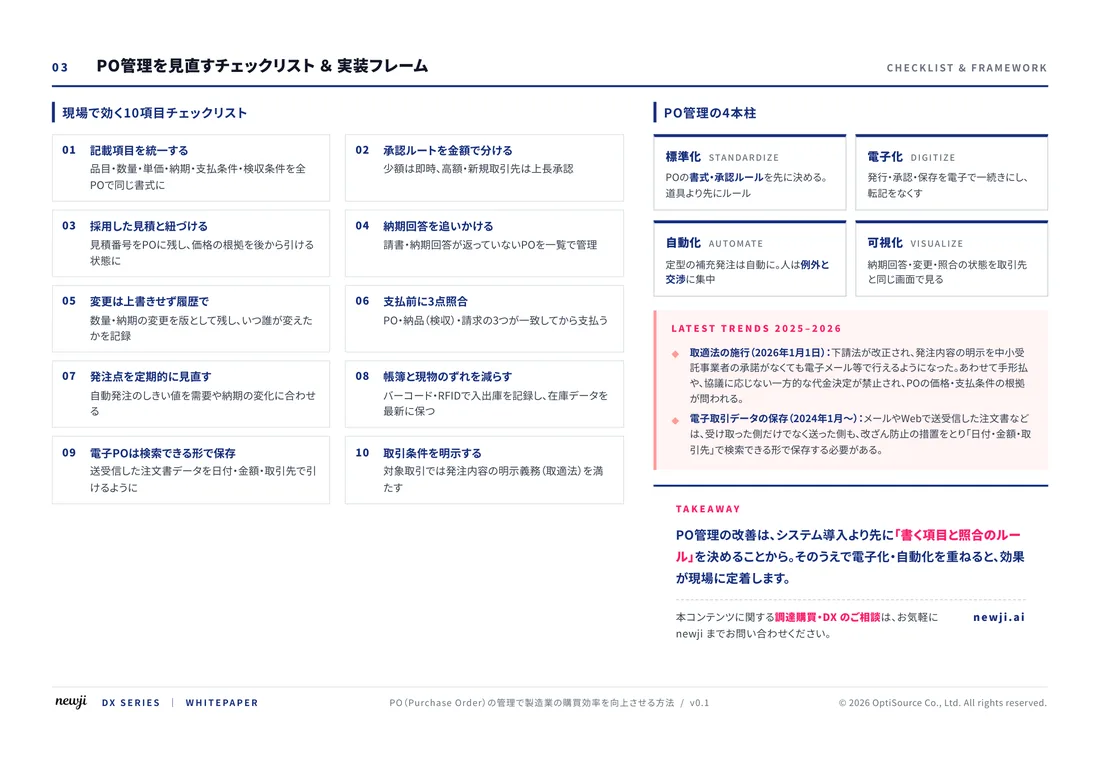
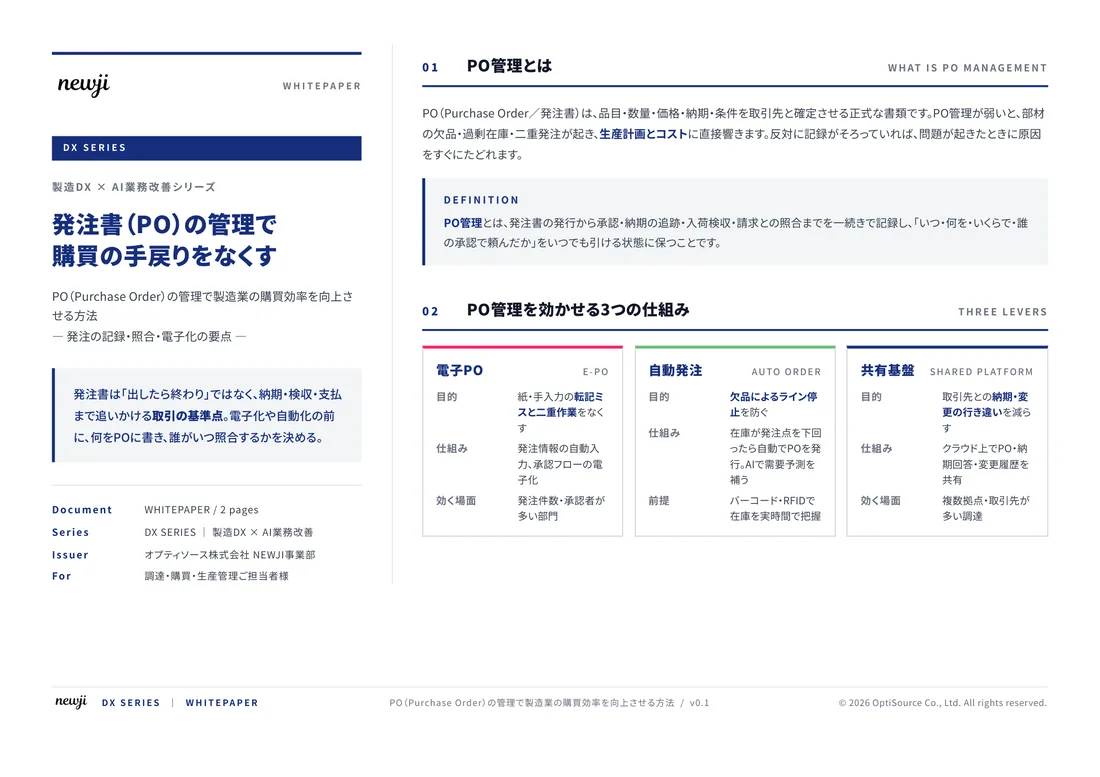
製造業の現場で使える実務資料(PDF)を無料でお届けします。"こんな資料が届きます" ↓ 下のボタンからどうぞ。
FREE DOCUMENT — サービス資料(PDF・無料)
製造業の見積・受発注クラウド
「Newji one」とは
Newji one は、製造業の調達・受発注に特化したクラウド/AIエージェント。見積依頼・発注書作成・進捗管理・承認をひとつの画面に集約し、AIが比較と異常検知を担当。最後の「GO」だけ人が押す仕組みです。
▶ 製造業の見積・受発注クラウド「Newji one」を、資料で見る(PDF・無料)
- 見積〜発注〜納期を一元管理。催促・転記のムダをゼロに
- AIが相見積もり比較と異常検知。あなたは判断だけに集中
- 取引先は「招待」で完全無料。自社コストだけで取引先ごとデジタル化
※ 取引先から招待された企業様は完全無料でご利用いただけます

 NEWJI総研
 OEM/ODM 生産委託
 AI/DX支援
 見積・発注クラウド Newji one
受発注が増えるほど、入力・確認・催促が重くなる。
受発注管理を“仕組み化“して、ミスと工数を削減しませんか。
見積・発注・納期まで一元管理できます。