

- お役立ち記事
- How to utilize Weibull analysis

How to utilize Weibull analysis

Understanding Weibull Analysis
Weibull analysis is a statistical method used to analyze life data, which helps in understanding product reliability and failure rates over time.
It was developed by Swedish professor Waloddi Weibull and is primarily used in reliability engineering and failure analysis.
By employing Weibull analysis, industries can predict a system’s lifespan, plan maintenance, and manage resources more effectively.
The Basics of Weibull Distribution
The Weibull distribution is a versatile statistical distribution that can simulate various types of life data.
It is characterized by two parameters: shape parameter (β) and scale parameter (η).
These parameters help determine the behavior of the distribution:
1. **Shape parameter (β):** This indicates the type of failure rate.
– If β < 1, it signifies a decreasing failure rate, often seen in early-life failures or infant mortality.
- If β = 1, it indicates a constant failure rate, typical of random failures.
- If β > 1, it conveys an increasing failure rate, common in wear-out failures where components fail due to age or usage.
2. **Scale parameter (η):** Represents the characteristic life or time by which 63.2% of the population will have failed.
Applications of Weibull Analysis
Weibull analysis finds relevance across various industries and applications, including:
1. **Product reliability:** Manufacturers use Weibull analysis to predict when a product is likely to fail, helping them improve design and production processes.
2. **Maintenance planning:** This analysis helps in scheduling preventive maintenance to minimize downtime and optimize equipment utilization.
3. **Quality control:** Organizations employ Weibull analysis to identify potential defects in production lines and enhance product quality.
4. **Risk management:** By understanding potential failure points, industries can implement risk mitigation strategies to enhance safety and performance.
Conducting a Weibull Analysis
To perform a Weibull analysis, follow these steps:
1. **Data collection:** Gather failure data, including the time to failure for multiple samples. This data can be complete (all items failed) or censored (not all items failed).
2. **Data preparation:** Organize the data in a tabular form, listing all failure times and identifying any censored data.
3. **Parameter estimation:** Use statistical software or manual calculations to estimate the shape (β) and scale (η) parameters. Methods such as Maximum Likelihood Estimation (MLE) or Rank Regression can be applied.
4. **Plotting data:** Create a Weibull probability plot, a graph where the x-axis represents failure times, and the y-axis is the cumulative percentage of failures. Plot the observed data points and the fitted Weibull distribution line.
5. **Interpretation:** Analyze the plot to determine the reliability and life characteristics of the product or system. Use this information to make predictions and guide decision-making.
Benefits of Weibull Analysis
The advantages of employing Weibull analysis include:
1. **Predictive insights:** It provides a means to forecast the lifespan and reliability of components or systems, enabling better planning for replacements or maintenance.
2. **Versatility:** The Weibull distribution can adapt to various types of life data, making it applicable to numerous industries and applications.
3. **Informed decision-making:** With Weibull analysis, organizations can make data-driven decisions to enhance product reliability and resource management.
4. **Cost savings:** By anticipating failures and optimizing maintenance schedules, companies can reduce downtime and extend equipment life, leading to substantial cost savings.
Challenges of Weibull Analysis
While Weibull analysis offers numerous benefits, there are certain challenges to consider:
1. **Data collection:** Accurate and comprehensive failure data is critical for reliable analysis, and obtaining it can be time-consuming and resource-intensive.
2. **Complex calculations:** Estimating the Weibull parameters may require specialized statistical software and expertise, complicating the process for some organizations.
3. **Model limitations:** Like any statistical model, the Weibull distribution may not perfectly fit all types of data, requiring adjustments or use of alternative models in some cases.
Conclusion
Weibull analysis is an essential tool in reliability engineering, providing valuable insights into product lifespan and potential failure rates.
By understanding the Weibull distribution and its applications, organizations can enhance their product designs, optimize maintenance schedules, and improve overall quality control.
Though there are challenges in data collection and parameter estimation, the benefits of informed decision-making and cost savings make Weibull analysis a worthwhile endeavor for businesses across diverse industries.
この記事の理解を深める
無料ホワイトペーパーをプレゼント
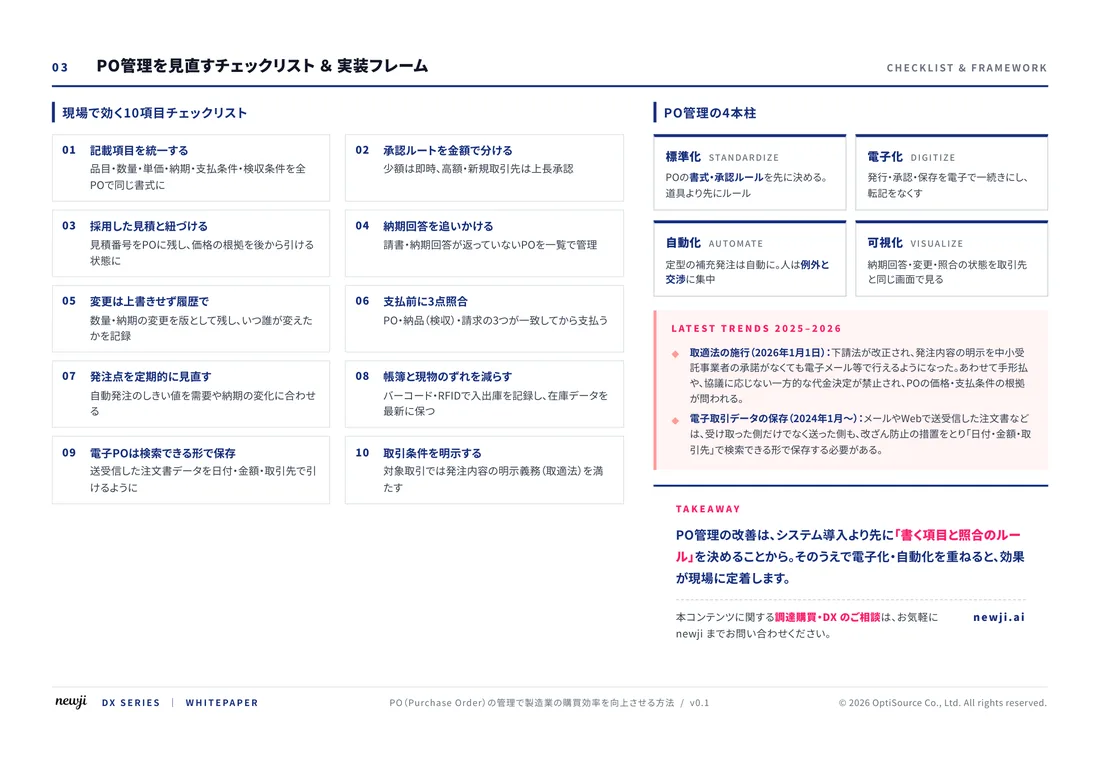
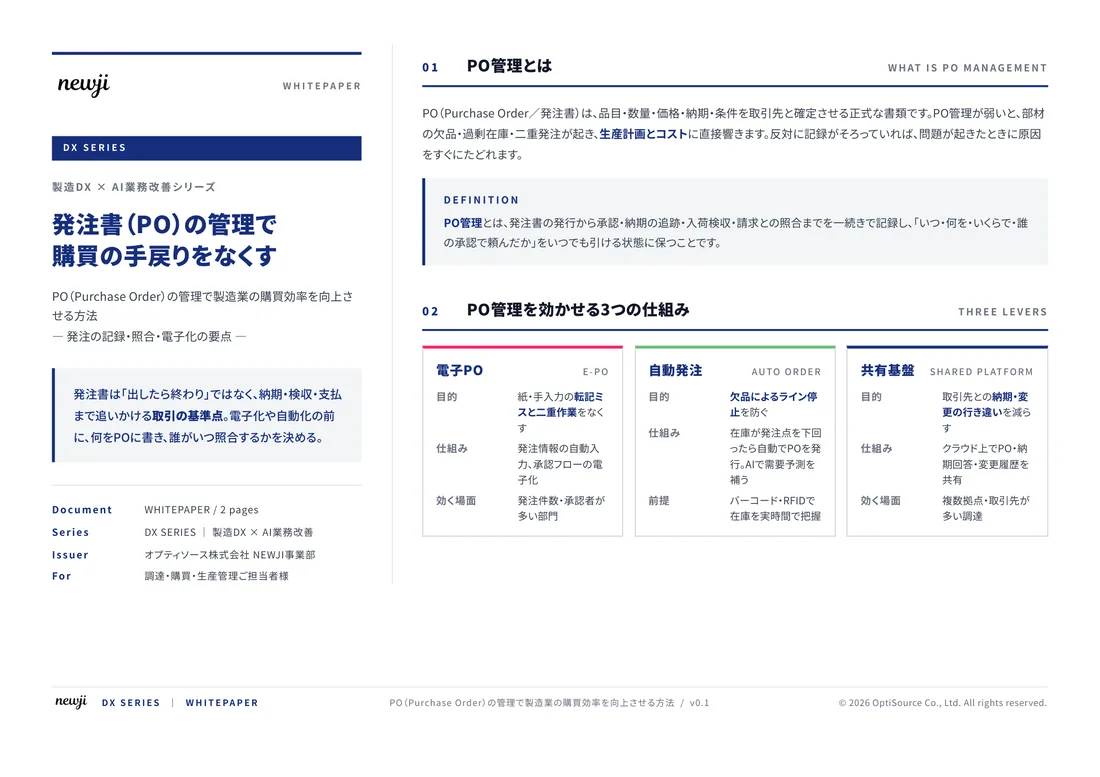
製造業の現場で使える実務資料(PDF)を無料でお届けします。"こんな資料が届きます" ↓ 下のボタンからどうぞ。
FREE DOCUMENT — サービス資料(PDF・無料)
製造業の見積・受発注クラウド
「Newji one」とは
Newji one は、製造業の調達・受発注に特化したクラウド/AIエージェント。見積依頼・発注書作成・進捗管理・承認をひとつの画面に集約し、AIが比較と異常検知を担当。最後の「GO」だけ人が押す仕組みです。
▶ 製造業の見積・受発注クラウド「Newji one」を、資料で見る(PDF・無料)
- 見積〜発注〜納期を一元管理。催促・転記のムダをゼロに
- AIが相見積もり比較と異常検知。あなたは判断だけに集中
- 取引先は「招待」で完全無料。自社コストだけで取引先ごとデジタル化
※ 取引先から招待された企業様は完全無料でご利用いただけます

 NEWJI総研
 OEM/ODM 生産委託
 AI/DX支援
 見積・発注クラウド Newji one
受発注が増えるほど、入力・確認・催促が重くなる。
受発注管理を“仕組み化“して、ミスと工数を削減しませんか。
見積・発注・納期まで一元管理できます。