

- お役立ち記事
- Understand multivariate analysis programmatically

スタートアップから大手まで。
調達・受発注をAIで標準化。
相見積比較も進捗管理もAIが下支え。取引先は招待で完全無料。

Understand multivariate analysis programmatically

目次
What is Multivariate Analysis?
Multivariate analysis involves observing and analyzing more than one statistical outcome variable at a time.
This approach is crucial in understanding patterns and relationships within a set of variables.
These statistical techniques allow us to make sense of large data sets where multiple measurements are involved.
Commonly used in fields like finance, healthcare, and social science, multivariate analysis helps in identifying trends, making predictions, and making informed decisions.
By diving into this analytical method programmatically, we can automate and enhance the efficiency of data processing.
Why Program Multivariate Analysis?
Automating multivariate analysis through programming offers several advantages.
Firstly, it allows for handling large datasets efficiently and consistently.
With a program, analyses that would typically take hours can be performed in seconds or minutes.
Moreover, programmatically adapting these techniques enables repeatability and reduces human error, providing more accurate and reliable results.
In industries such as marketing and research, this can lead to better insights and strategic decisions.
Programming also allows for customization, meaning you can tailor analyses to the specific needs of your project or inquiry.
Getting Started with Programmatic Multivariate Analysis
When starting with programmatic multivariate analysis, it’s essential to select an appropriate language or framework.
Python, with its vast array of libraries such as Pandas, NumPy, and Scikit-learn, is a popular choice for data analysis due to its readability and community support.
R is another excellent option, especially for those with a statistics background, offering packages like ggplot2 and dplyr.
Regardless of the choice of language, becoming familiar with their specific environments and data handling capabilities is crucial.
Additionally, access to a robust integrated development environment (IDE), like Jupyter or RStudio, can enhance productivity and streamline the analysis process.
Preparing Your Data
Before diving into analysis, it’s crucial to prepare your data appropriately.
Data cleansing and preprocessing are vital steps to ensure quality and accuracy in your results.
This involves handling missing or inconsistent data entries, coding categorical variables, and standardizing or normalizing your data where necessary.
Exploratory data analysis (EDA) is also essential to understand your data better.
This involves summarizing the main characteristics of your dataset, often with visual methods.
EDA helps in making decisions on how best to apply multivariate analysis methods.
Common Multivariate Analysis Techniques
There are several multivariate analysis techniques that one can approach programmatically.
Principal Component Analysis (PCA)
PCA is a dimensionality-reduction technique.
It transforms a large set of variables into a smaller one that still contains most of the information in the large set.
This technique is particularly useful when dealing with highly correlated variables.
Using Python, the Scikit-learn library offers a straightforward method to perform PCA, dramatically simplifying the computational process.
Cluster Analysis
Also known as segmentation analysis, this method categorizes data points into groups with similar features.
It is beneficial for market segmentation, grouping customers into clusters based on purchasing behaviors.
Libraries such as Scikit-learn in Python make implementing algorithms like K-means clustering efficient and straightforward.
Factor Analysis
This technique identifies the underlying relationships between variables, uncovering latent variables that explain observed data patterns.
Factor analysis is invaluable in research fields, especially psychology and social sciences.
Certain packages in R, such as psych, provide functionalities for performing factor analysis effectively.
Multivariate Regression
Regression with multiple dependent variables allows for the determination of relationships between variables.
Programmatically, this can be achieved using Python’s Statsmodels or R’s lm function.
These tools allow you to build predictive models that can forecast future outcomes.
Interpreting the Results
Once you have run your analysis, interpreting the results is a critical step.
Understanding the insights drawn from your data involves a combination of statistical knowledge and domain expertise.
Certain visualization libraries, like Matplotlib and Seaborn in Python, can help in translating complex results into understandable graphics.
Always ensure to validate your results by checking for anomalies, biases, and ensuring the assumptions of your applied methods are met.
Applications of Multivariate Analysis
Multivariate analysis is extensively used in various fields for different purposes.
In finance, it’s crucial for risk management and portfolio evaluation.
In healthcare, multivariate methods can predict disease outbreaks or patient treatment outcomes.
Similarly, social sciences use these techniques to analyze demographic trends and behaviors.
Applying multivariate analysis programmatically can thus provide significant insights across various industries and research areas.
Challenges and Considerations
While programmatically executing multivariate analysis offers many benefits, it also presents challenges.
Data quality and the appropriateness of the chosen analysis method are critical factors.
It’s paramount to ensure that models are not overfitted, as this can lead to misleading and non-generalizable results.
Moreover, it’s crucial to address ethical considerations when dealing with sensitive data to avoid biases that can arise in automated processes.
Tools and methods should be constantly evaluated and updated to ensure they meet the current data landscapes and requirements.
Conclusion
Multivariate analysis, when approached programmatically, offers immense potential to harness the power of data.
Whether in research, business, or technology, understanding and applying these techniques can lead to more informed decisions and innovations.
As data sources become increasingly complex, mastering programmatic multivariate analysis becomes a pivotal skill in the digital age.
この記事の理解を深める
無料ホワイトペーパーをプレゼント
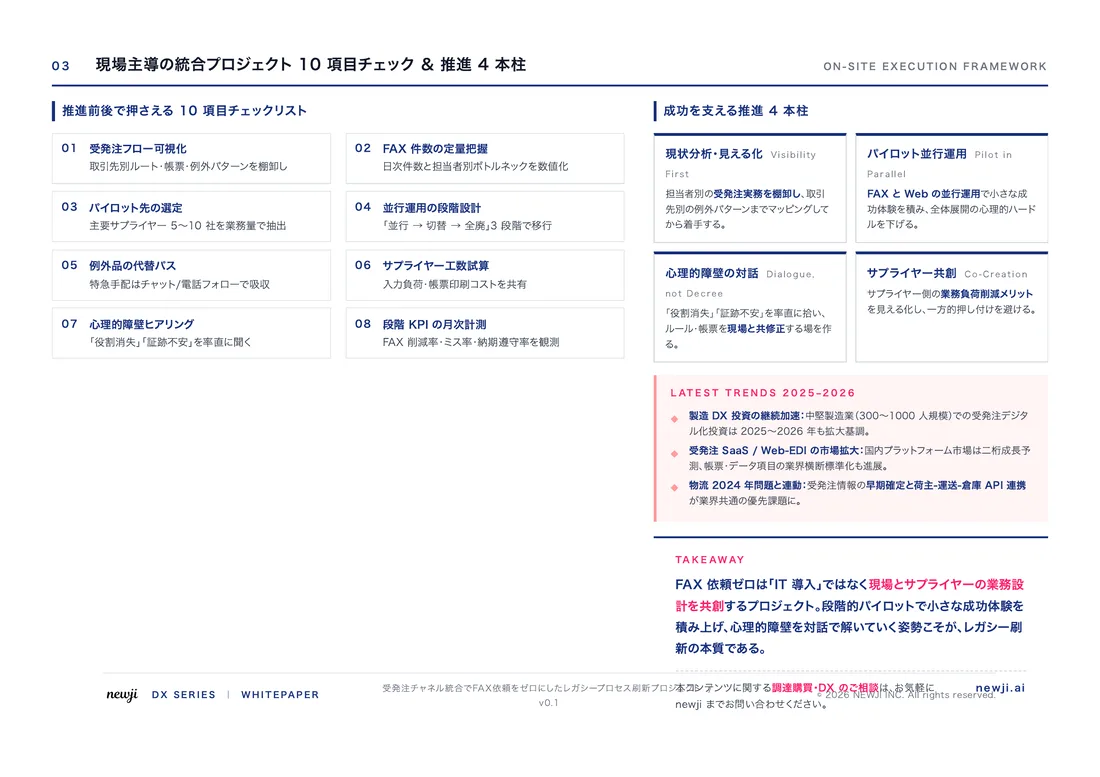
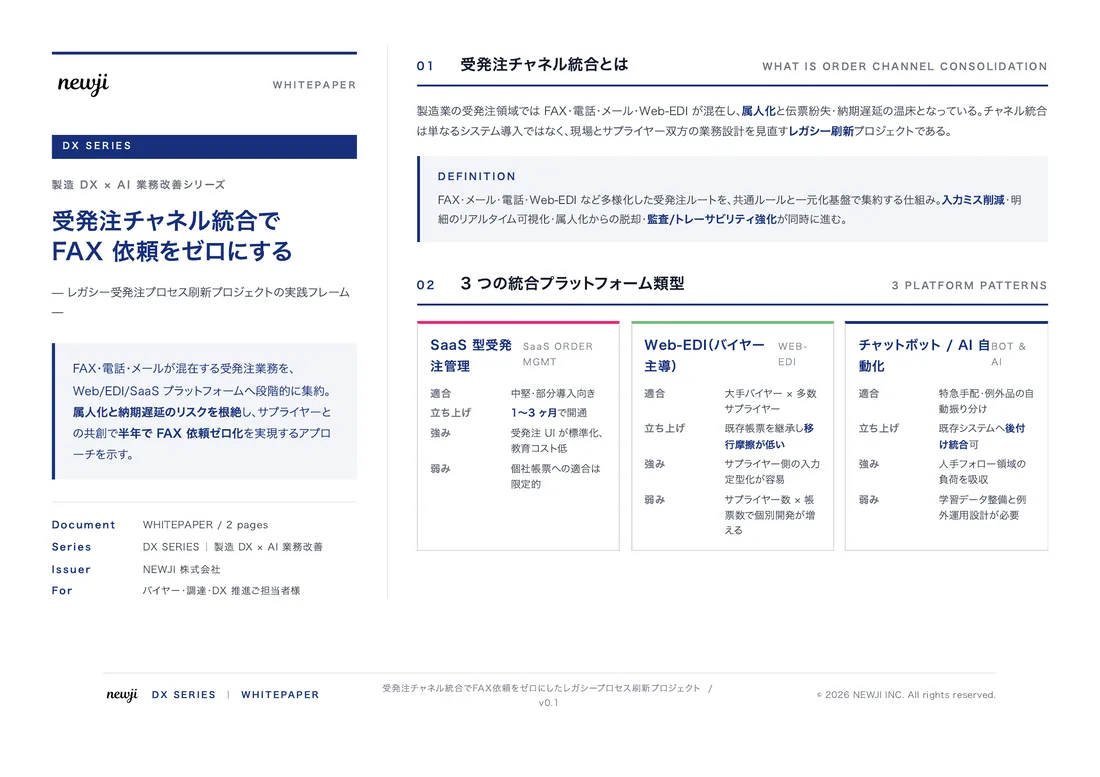
製造業の現場で使える実務資料(PDF)を無料でお届けします。"こんな資料が届きます" ↓ 下のボタンからどうぞ。
PRODUCT — 製造業向け 調達・受発注クラウド
この記事の課題、
newji で解決しませんか?
newji は、製造業の調達・受発注に特化したクラウド/AIエージェント。見積依頼・発注書作成・進捗管理・承認をひとつの画面に集約し、AIが比較と異常検知を担当。最後の「GO」だけ人が押す仕組みです。
- 見積〜発注〜納期を一元管理。催促・転記のムダをゼロに
- AIが相見積もり比較と異常検知。あなたは判断だけに集中
- 取引先は「招待」で完全無料。自社コストだけで取引先ごとデジタル化
※ 取引先から招待された企業様は完全無料でご利用いただけます


 調達購買アウトソーシング
 OEM/ODM 生産委託
 NEWJI DX
 受発注AIエージェント