

- お役立ち記事
- Multiple regression analysis and application examples

その単価は妥当か。
AI が根拠付きで分析。
相見積の比較も発注も進捗管理も、ひとつの画面に。

Multiple regression analysis and application examples

目次
What is Multiple Regression Analysis?
Multiple regression analysis is a statistical technique used to study the relationship between one dependent variable and two or more independent variables.
This method helps in understanding how various factors influence the outcome variable and the strength of their impact.
It is an extension of simple linear regression, which only uses one independent variable to predict a dependent variable.
Multiple regression analysis provides a detailed and comprehensive view, allowing researchers and analysts to make informed decisions based on the analysis results.
Understanding the Basics
At its core, multiple regression analysis involves finding the best-fitting line or equation that represents the relationship between the dependent and independent variables.
This line is represented by a mathematical equation:
\[ Y = b_0 + b_1X_1 + b_2X_2 + … + b_nX_n + e \]
In this equation:
– \( Y \) is the dependent variable.
– \( b_0 \) is the intercept.
– \( b_1, b_2, … b_n \) are the coefficients of the independent variables \( X_1, X_2, … X_n \).
– \( e \) represents the error term.
The goal is to determine the values of the coefficients that minimize the difference between the predicted and actual values of the dependent variable.
Applications of Multiple Regression Analysis
Multiple regression analysis is widely used across different fields to identify relationships and predict outcomes.
Its applications are essential in various areas:
1. Business and Economics
In business, companies use multiple regression analysis to forecast sales, determine pricing strategies, and evaluate marketing tactics.
For instance, a company may analyze how factors like advertising budget, market trends, and consumer income levels affect product sales.
Economists use multiple regression to study the impact of variables such as interest rates, unemployment, and consumer spending on economic growth.
This helps policymakers and entrepreneurs make informed decisions about investments, resource allocation, and economic policy.
2. Healthcare
In healthcare, researchers utilize multiple regression analysis to examine the influence of numerous factors on health outcomes.
For example, medical professionals may investigate how age, gender, lifestyle, and pre-existing medical conditions contribute to the development of certain diseases.
This analysis aids in identifying risk factors and developing preventive strategies to improve public health and patient outcomes.
3. Education
Education professionals employ multiple regression analysis to evaluate the impact of different educational interventions and strategies on student performance.
Factors like class size, teaching methods, and socio-economic background can all be analyzed to determine their effect on academic achievement.
This information helps in designing more effective educational programs that enhance learning and teaching experiences.
4. Environmental Studies
Environmental scientists use multiple regression analysis to assess the effect of various environmental factors on climate change, pollution levels, and ecosystem health.
By analyzing data on temperature, precipitation, industrial output, and agricultural practices, researchers can better understand how these elements impact the environment.
The results can inform policy decisions aimed at combating climate change and preserving natural resources.
Steps in Conducting a Multiple Regression Analysis
Conducting a multiple regression analysis involves several key steps to ensure accurate and meaningful results:
1. Formulate the Research Question
Start by clearly defining the research question or hypothesis you want to investigate.
Determine the dependent variable you wish to predict and the independent variables you believe have an impact on it.
A well-defined research question ensures that the analysis remains focused and relevant.
2. Collect and Prepare Data
Gather the necessary data for both the dependent and independent variables.
Ensure that the data is accurate, complete, and free from errors or inconsistencies.
Clean the data by handling missing values, outliers, and any data anomalies that may affect the analysis.
3. Choose the Right Model
Select the appropriate multiple regression model based on the research question and data structure.
Consider the nature of the variables and any potential interactions or non-linear relationships.
Different models, such as linear, logistic, or polynomial regression, may be employed depending on the analysis requirements.
4. Perform the Regression Analysis
Use statistical software or tools to run the regression analysis and obtain the regression equation.
Interpret the regression coefficients to understand the magnitude and direction of the relationships between variables.
Evaluate the goodness-of-fit measures, such as R-squared and adjusted R-squared, to assess the model’s explanatory power.
5. Validate the Model
Ensure the model’s validity and reliability by using techniques such as cross-validation or splitting the data into training and testing sets.
Check for any violations of regression assumptions, such as multicollinearity, autocorrelation, and heteroscedasticity.
Refine the model if necessary to improve its accuracy and predictive capabilities.
Conclusion
Multiple regression analysis is a powerful tool that provides valuable insights into the complex relationships among multiple variables.
It offers numerous applications across different fields, from business and economics to healthcare, education, and environmental studies.
By following a structured process for conducting the analysis, researchers and analysts can draw accurate and actionable conclusions that inform decision-making and drive innovation.
Understanding the intricacies of multiple regression analysis empowers professionals to leverage data for solving real-world problems and enhancing outcomes across various domains.
この記事の理解を深める
無料ホワイトペーパーをプレゼント
製造業の現場で使える実務資料(PDF)を無料でお届けします。"こんな資料が届きます" ↓ 下のボタンからどうぞ。
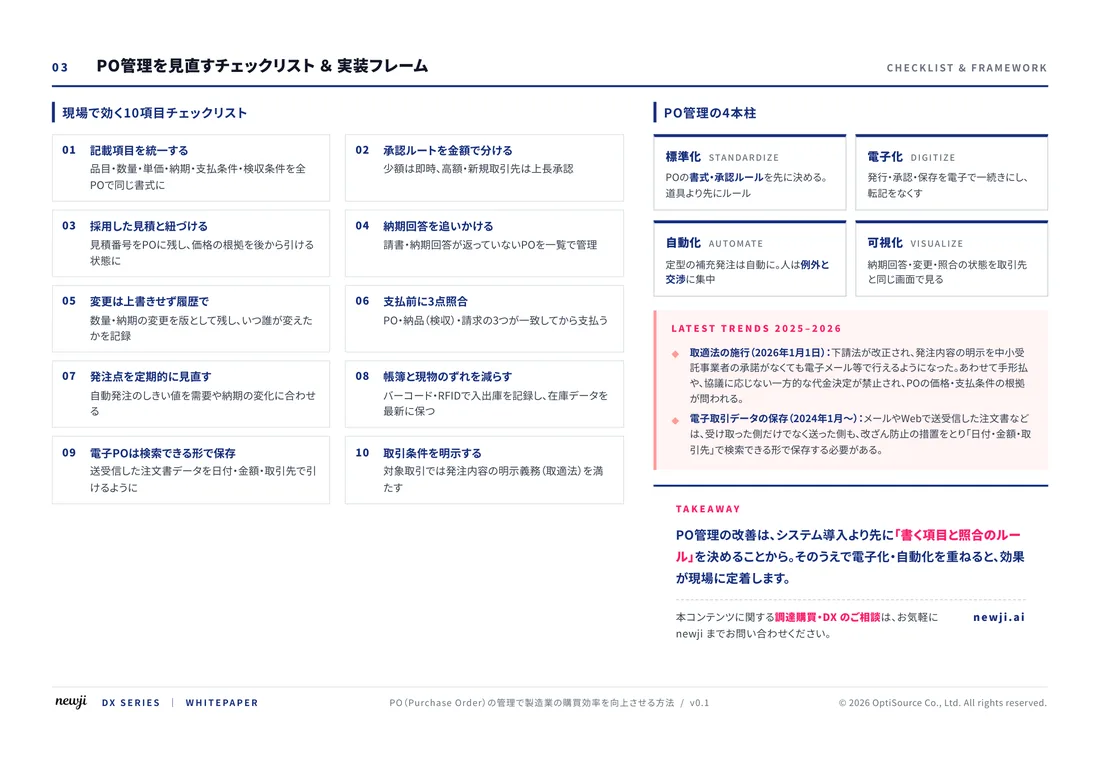
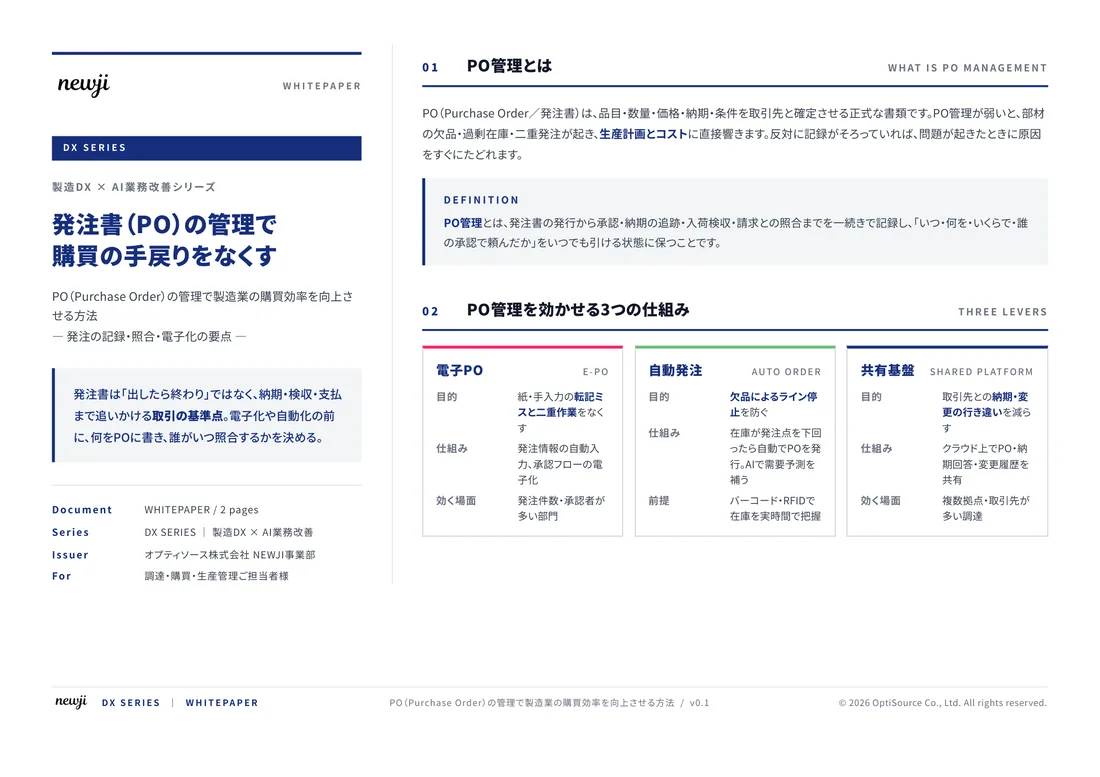
FREE DOCUMENT — サービス資料(PDF・無料)
製造業の見積・受発注クラウド
「Newji one」とは
Newji one は、製造業の調達・受発注に特化したクラウド/AIエージェント。見積依頼・発注書作成・進捗管理・承認をひとつの画面に集約し、AIが比較と異常検知を担当。最後の「GO」だけ人が押す仕組みです。
▶ 製造業の見積・受発注クラウド「Newji one」を、資料で見る(PDF・無料)
- 見積〜発注〜納期を一元管理。催促・転記のムダをゼロに
- AIが相見積もり比較と異常検知。あなたは判断だけに集中
- 取引先は「招待」で完全無料。自社コストだけで取引先ごとデジタル化
※ 取引先から招待された企業様は完全無料でご利用いただけます

 NEWJI総研
 OEM/ODM 生産委託
 AI/DX支援
 見積・発注クラウド Newji one
受発注が増えるほど、入力・確認・催促が重くなる。
受発注管理を“仕組み化“して、ミスと工数を削減しませんか。
見積・発注・納期まで一元管理できます。