

- お役立ち記事
- Fundamentals of data science and practice of data analysis with Python

スタートアップから大手まで。
調達・受発注をAIで標準化。
相見積比較も進捗管理もAIが下支え。取引先は招待で完全無料。

Fundamentals of data science and practice of data analysis with Python

目次
Introduction to Data Science
Data science is an ever-evolving field that combines domain expertise, programming skills, and knowledge of mathematics and statistics to extract meaningful insights from data.
At its core, data science aims to identify patterns and make informed decisions based on those patterns.
It’s a field that has grown rapidly due to the increased availability of data and advancements in computing power.
Data science encompasses various processes such as data collection, cleaning, analysis, visualization, and interpretation.
Whether it’s predicting customer behavior, optimizing marketing strategies, or developing algorithms for autonomous vehicles, data science has become integral to many industries.
The Importance of Data Analysis
Data analysis is a critical component of data science.
It involves inspecting, cleaning, transforming, and modeling data to discover useful information.
This process not only enhances decision-making but also helps in understanding complex data sets.
Data analysis is critical in identifying trends, testing hypotheses, and ensuring data quality.
For businesses, effective data analysis can lead to improved customer satisfaction, better product development, and even financial savings.
Types of Data Analysis
Data analysis can be categorized into several types, depending on the intended outcome:
– **Descriptive Analysis:** This is used to summarize or describe a set of data.
It provides simple summaries and visualizations, such as mean, median, charts, and graphs.
Descriptive analysis helps in understanding past occurrences.
– **Diagnostic Analysis:** This analysis is performed to determine the reasons behind a certain event.
It’s like diagnosing a problem to understand what went wrong and why.
– **Predictive Analysis:** As the name suggests, predictive analysis is used to predict future outcomes based on historical data.
It employs various statistical and machine learning models to forecast trends.
– **Prescriptive Analysis:** This goes a step further by suggesting actions that can affect desired outcomes.
It not only forecasts what could happen but also provides insights into what you should do about it.
Why Python for Data Analysis?
Python has become one of the go-to languages for data analysis, and for a good reason.
Here’s why Python is preferred for data analysis:
– **Ease of Use and Simplicity:** Python’s syntax is straightforward and readable, making it easier for data scientists to write and maintain code.
Its simplicity allows analysts to focus more on solving data problems rather than on learning complex programming intricacies.
– **Rich Ecosystem of Libraries:** Python boasts a wealth of libraries that are specifically designed for data analysis.
Libraries like Pandas, NumPy, Matplotlib, and Scikit-learn provide powerful tools for data manipulation, statistical analysis, and machine learning.
– **Community Support:** Python has a large and active community.
This means an abundance of resources, tutorials, and forums where data scientists can seek help or collaborate on projects.
Continuous contributions from developers enhance Python’s libraries and tools.
– **Versatility:** Python is not limited to just data analysis.
It can be used for web development, automation, artificial intelligence, and more.
This versatility makes Python a popular choice among a wide range of industries.
Getting Started with Python for Data Analysis
For those new to Python or data analysis, the starting point involves setting up the right environment and learning the fundamentals of Python programming.
Setting Up Your Environment
To perform data analysis with Python, you’ll need to set up your environment.
Anaconda is a popular distribution for managing Python packages and is ideal for beginners.
It includes all necessary libraries and tools and comes with Jupyter Notebooks, a web-based interactive platform for data analysis, visualization, and presentation.
Basics of Python Programming
Understanding Python’s fundamentals is crucial.
You’ll need to learn about data types, control structures like loops and conditionals, functions, and file handling.
Familiarity with Python’s object-oriented programming can enhance your ability to perform complex data manipulations.
Key Libraries for Data Analysis
Several Python libraries are essential for conducting data analysis efficiently.
Pandas
Pandas is perhaps the most popular library for data manipulation and analysis.
It provides data structures like Series and DataFrame, which allow for easy data handling and transformation.
With Pandas, you can perform operations such as data cleaning, filtering, merging, and aggregation with ease.
NumPy
NumPy supports large, multi-dimensional arrays and matrices, along with a collection of mathematical functions.
It is fundamental for scientific computing and acts as the backbone for many other data science libraries.
Matplotlib and Seaborn
Matplotlib is a plotting library used for creating static, interactive, and animated visualizations in Python.
For more aesthetically pleasing and complex visualizations, Seaborn builds on Matplotlib’s foundations.
Scikit-learn
Scikit-learn is a library tailored for machine learning in Python.
It provides simple and efficient tools for data mining and data analysis, offering a range of algorithms for classification, regression, clustering, and more.
Data Analysis Workflow
A structured approach to data analysis can make the process more efficient and productive.
Below is a general workflow:
Data Collection
Data can be collected from various sources like databases, APIs, and web scraping.
Ensuring data quality at this stage is important as it affects subsequent analysis.
Data Cleaning
Data cleaning involves handling missing values, removing duplicates, and correcting inconsistencies.
This step ensures the dataset’s integrity and accuracy.
Data Exploration
Data exploration is where you gain initial insights about the data.
Using visualizations and summary statistics, you can identify patterns or anomalies that might affect analysis.
Data Modeling
In this step, statistical or machine learning models are applied to understand relationships within the data.
The choice of model depends on the analysis type and the data’s nature.
Data Interpretation
The final step involves interpreting model results and drawing conclusions.
Clear visualization and communication of findings are crucial for stakeholders to make informed decisions.
Conclusion
Data science and data analysis with Python are dynamic and indispensable tools in understanding the vast amounts of data generated today.
By mastering Python’s libraries and understanding the data analysis workflow, one can extract valuable insights and drive strategic decisions across various platforms.
この記事の理解を深める
無料ホワイトペーパーをプレゼント
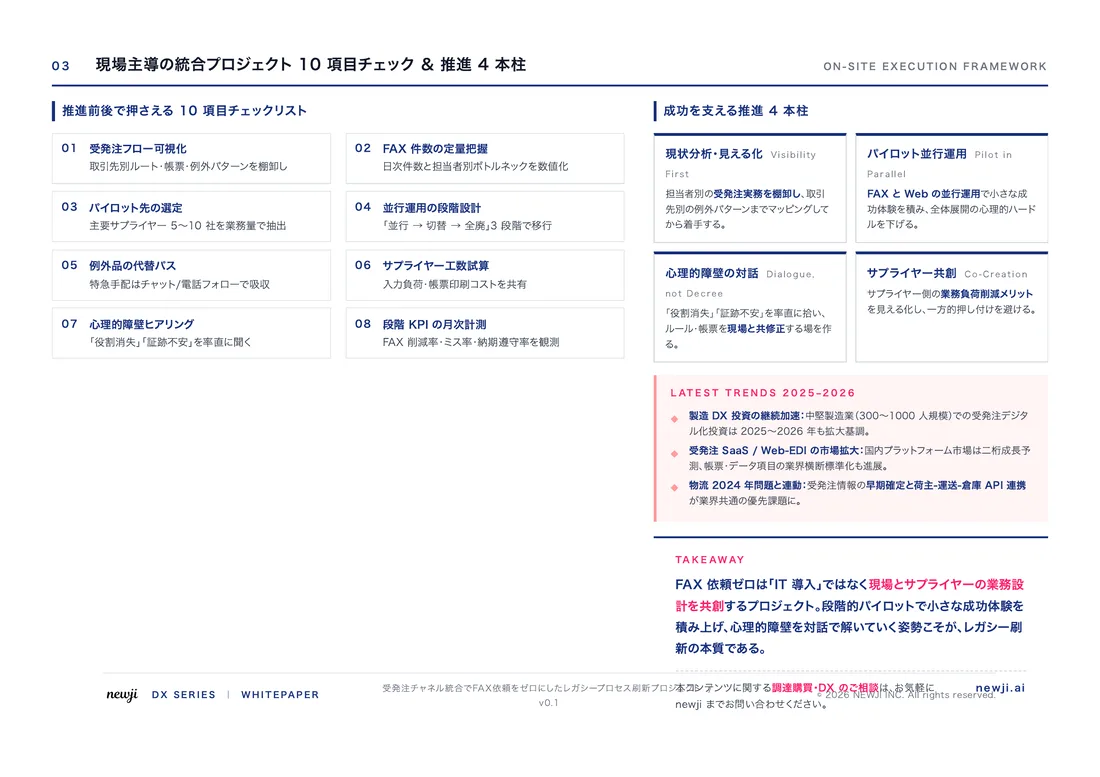
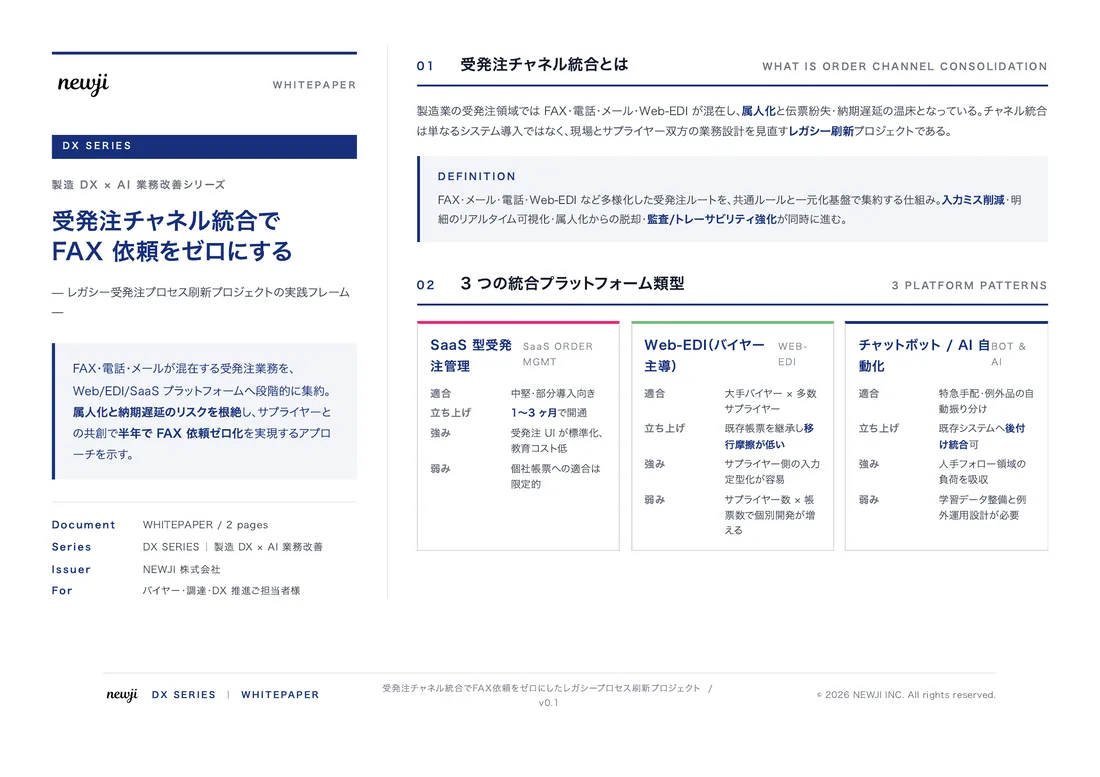
製造業の現場で使える実務資料(PDF)を無料でお届けします。"こんな資料が届きます" ↓ 下のボタンからどうぞ。
PRODUCT — 製造業向け 調達・受発注クラウド
この記事の課題、
newji で解決しませんか?
newji は、製造業の調達・受発注に特化したクラウド/AIエージェント。見積依頼・発注書作成・進捗管理・承認をひとつの画面に集約し、AIが比較と異常検知を担当。最後の「GO」だけ人が押す仕組みです。
- 見積〜発注〜納期を一元管理。催促・転記のムダをゼロに
- AIが相見積もり比較と異常検知。あなたは判断だけに集中
- 取引先は「招待」で完全無料。自社コストだけで取引先ごとデジタル化
※ 取引先から招待された企業様は完全無料でご利用いただけます


 調達購買アウトソーシング
 OEM/ODM 生産委託
 NEWJI DX
 受発注AIエージェント