

- お役立ち記事
- How to create an anomaly dashboard that automatically detects price triggers

スタートアップから大手まで。
調達・受発注をAIで標準化。
相見積比較も進捗管理もAIが下支え。取引先は招待で完全無料。

How to create an anomaly dashboard that automatically detects price triggers

目次
Understanding Anomaly Dashboards
An anomaly dashboard is a crucial tool for businesses and organizations that need to monitor unexpected deviations in their data, such as price triggers.
It provides real-time insights and helps in decision-making processes by highlighting unusual patterns or changes.
By automatically detecting these anomalies, companies can promptly respond to discrepancies, minimizing potential losses and optimizing operations.
The Importance of Detecting Price Triggers
Price triggers in business can significantly impact profitability and market competitiveness.
They represent sudden changes in price that could result from various factors like market demand, supply issues, or competitor actions.
Detecting these triggers allows businesses to adjust their strategies promptly, ensuring that they remain competitive and profitable.
Anomaly dashboards can significantly aid in this regard.
They not only highlight when these price changes occur but also provide insight into the underlying reasons, helping businesses to strategize effectively.
Setting Up Your Anomaly Dashboard
Creating an effective anomaly dashboard involves several important steps.
1. Define Your Objectives
Before diving into technical aspects, it is essential to clearly define the purpose of your anomaly dashboard.
Determine which metrics or data points are critical for your business.
For instance, if you are in the retail sector, you might want to focus on product pricing, inventory levels, and sales volume.
2. Choose the Right Tools
There are various tools available for setting up anomaly dashboards, such as Tableau, Power BI, and specialized platforms like Datadog or Splunk.
These tools come with built-in functionalities for real-time monitoring and anomaly detection.
Select a tool that best fits your organization’s requirements and budget.
Consider factors such as ease of use, integration capabilities, and scalability when making your choice.
3. Collect and Clean Your Data
Anomalies can only be detected if the data input is accurate and comprehensive.
Hence, gather data from reliable sources and ensure it’s properly cleaned.
Remove any duplicates, outliers, or errors that could skew your analysis.
This step is critical in ensuring that your dashboard reflects true and actionable insights.
4. Establish Baselines and Thresholds
Once your data is ready, establish baselines and thresholds for your key metrics.
A baseline is the normal range of values that your data should fall into under typical conditions.
Thresholds, on the other hand, are predefined limits that, when crossed, indicate a potential anomaly.
Collaborate with stakeholders to set these parameters, considering historical data and business objectives to ensure they align with strategic goals.
The Technical Setup
Implementing Anomaly Detection Algorithms
Different algorithms can be deployed to identify anomalies effectively.
Some popular methods include:
– **Statistical Methods**: These involve using statistical tests to determine if data deviates from expected patterns.
– **Machine Learning Techniques**: Algorithms like k-means clustering, Support Vector Machines (SVM), or Neural Networks can be used to train models on historical data, improving the precision of anomaly detection.
– **Time Series Analysis**: Perfect for data with temporal components, this method analyzes data points collected or recorded at regular intervals.
Select the approach that best suits the nature of your data and objectives.
Integrate this algorithm into your dashboard to enable real-time anomaly detection.
Visualizing Data for Better Insights
Effective visualization is key to understanding anomalies quickly and accurately.
Use charts, graphs, and heat maps to represent complex data succinctly.
Dashboards should be intuitive, allowing users to interpret data at a glance.
Ensure that anomalies are prominently highlighted with visual cues, making it easy to identify and investigate them further.
Regularly Update and Maintain the Dashboard
To maintain the dashboard’s efficacy, updates are essential.
Regularly refine algorithms based on new data, improving their accuracy in detecting anomalies.
Always keep your data inputs fresh.
This means continuously streaming real-time data into the system and archiving old data to avoid unnecessary clutter that could slow down analysis.
Conclusion
Anomaly dashboards that automatically detect price triggers are invaluable assets for modern businesses.
They provide critical insights, allowing organizations to respond swiftly to unexpected changes in pricing.
By carefully defining objectives, choosing the right tools, and implementing robust algorithms, you can create a dashboard that not only alerts you to anomalies but also guides strategic decision-making.
Embrace this technological advancement and give your business the proactive capability to stay ahead in an ever-fluctuating marketplace.
この記事の理解を深める
無料ホワイトペーパーをプレゼント
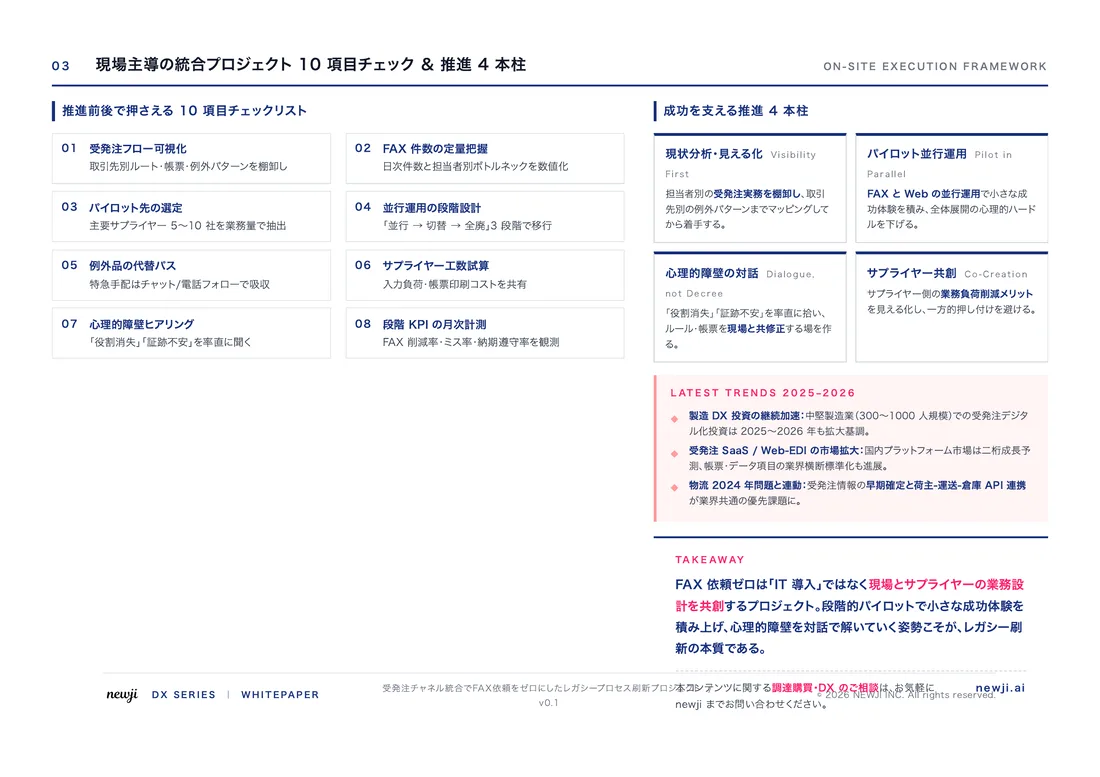
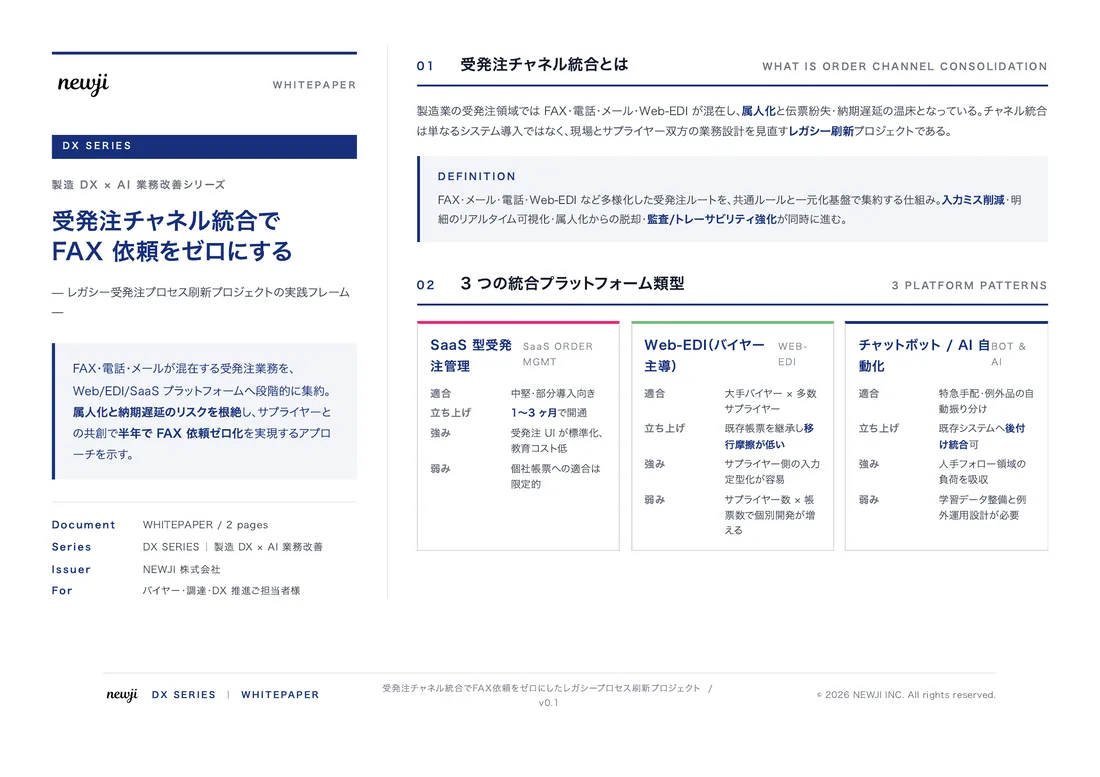
製造業の現場で使える実務資料(PDF)を無料でお届けします。"こんな資料が届きます" ↓ 下のボタンからどうぞ。
PRODUCT — 製造業向け 調達・受発注クラウド
この記事の課題、
newji で解決しませんか?
newji は、製造業の調達・受発注に特化したクラウド/AIエージェント。見積依頼・発注書作成・進捗管理・承認をひとつの画面に集約し、AIが比較と異常検知を担当。最後の「GO」だけ人が押す仕組みです。
- 見積〜発注〜納期を一元管理。催促・転記のムダをゼロに
- AIが相見積もり比較と異常検知。あなたは判断だけに集中
- 取引先は「招待」で完全無料。自社コストだけで取引先ごとデジタル化
※ 取引先から招待された企業様は完全無料でご利用いただけます


 調達購買アウトソーシング
 OEM/ODM 生産委託
 NEWJI DX
 受発注AIエージェント