

- お役立ち記事
- How to create patent maps and implement IP strategies in the IP landscape

How to create patent maps and implement IP strategies in the IP landscape

目次
Understanding Patent Maps
Patent maps are visual representations of patent data, showcasing how different patents are related to each other in terms of technology, application, and value.
These maps are incredibly useful tools for companies and individuals interested in intellectual property (IP) as they provide a comprehensive view of the IP landscape.
Patent maps categorize and organize patent data into clusters or groups.
This categorization helps in identifying trends, gaps, and opportunities within a specific sector.
They also assist in visualizing relationships among different patents, which can be instrumental for competitive analysis and strategic planning.
Components of a Patent Map
Creating a patent map involves several key components.
1. Collecting Patent Data: The initial step is to gather relevant patent data from databases such as the United States Patent and Trademark Office (USPTO), the European Patent Office (EPO), and other global patent repositories.
2. Analyzing the Data: Once data is collected, the next step is to analyze it for trends, similarities, and differences.
3. Categorizing Patents: This involves grouping patents based on technology, application, or the companies they belong to.
4. Visual Representation: Finally, the information is represented visually, often using software tools designed for patent mapping.
Benefits of Patent Maps in the IP Landscape
Patent maps contribute significantly to crafting effective IP strategies.
Identifying Trends and Innovations
Patent maps are valuable in identifying trends and technological advancements in a particular industry.
By analyzing these maps, companies can pinpoint emerging technologies and focus their research and development efforts accordingly.
Strategic IP Planning
Businesses can use patent maps to plan their IP strategies effectively.
These maps help in understanding the competitive landscape and the direction in which competitors are heading with their innovations.
This information can influence decisions on patent filing and help in positioning a company’s unique offerings in the market.
Avoiding Patent Infringements
Patent maps serve as a guide to navigate the complex world of patents.
By understanding where existing patents lie, companies can avoid potential infringement issues by modifying their designs or filing for a new patent in a less crowded area.
Opportunities for Collaboration
These maps can also highlight opportunities for collaboration.
By identifying complementary patents owned by other companies, businesses can forge partnerships and share resources to develop new technologies.
Steps to Create a Patent Map
Here’s a step-by-step guide to creating an effective patent map.
Step 1: Define Objectives
Clearly defining the objectives of the patent map is crucial.
Are you looking to identify new market opportunities, track competitors, or scout for potential partners?
This will guide the entire mapping process.
Step 2: Gather Patent Data
Access patent databases like Google Patents, USPTO, PATENTSCOPE, or commercial databases like Derwent Innovation.
Collect data using relevant keywords, class codes, or by the companies of interest.
Step 3: Data Cleaning and Preparation
Before analysis, clean the data for duplicates and irrelevant entries.
Organizing the data into usable formats is critical.
Step 4: Identify Key Metrics
Identify critical metrics such as the number of filings over time, geographic distribution, citation frequency, and technological classifications.
This step provides a framework for analysis.
Step 5: Categorize the Data
Group patents into categories based on application areas, technology types, or owners.
This categorization facilitates deeper analysis and clearer insights.
Step 6: Choose Mapping Software
Select a patent mapping tool that best suits your needs.
Tools like VantagePoint, Innography, or Questel provide functionalities to create detailed maps and export them for presentation.
Step 7: Analyze and Visualize
Create visual representations of the data using graphs, charts, and diagrams.
Highlighting connections among patents helps in identifying patterns and making informed strategic decisions.
Implementing IP Strategies Using Patent Maps
Once a patent map is developed, it becomes a powerful tool for implementing IP strategies.
Refining Product Development
Using insights from patent maps, companies can refine their R&D processes.
By understanding existing technologies and gaps, innovation can be steered toward less crowded segments.
Mitigation of Risk
Patent maps assist in risk mitigation by identifying potential infringement scenarios well in advance.
This proactive approach can save a company from costly lawsuits and licensing fees.
Market Entry and Expansion
Patent maps help in understanding the feasibility of entering a new market.
By analyzing the IP landscape of a region, businesses can decide on jurisdictions for filing patents or recognize promising regions for expansion.
Enhancing Negotiation Power
Armed with data from patent maps, companies gain a better understanding of their position in the IP landscape.
This can enhance their negotiation power during cross-licensing deals or disputes.
Conclusion
Patent maps are invaluable to businesses aiming to navigate the complex IP landscape effectively.
By utilizing patent maps, companies can strategically align their R&D efforts, mitigate risks, and seize opportunities for innovation and collaboration.
In a rapidly evolving technological world, implementing strategic IP management with tools like patent maps is not just advantageous but essential.
この記事の理解を深める
無料ホワイトペーパーをプレゼント
製造業の現場で使える実務資料(PDF)を無料でお届けします。"こんな資料が届きます" ↓ 下のボタンからどうぞ。
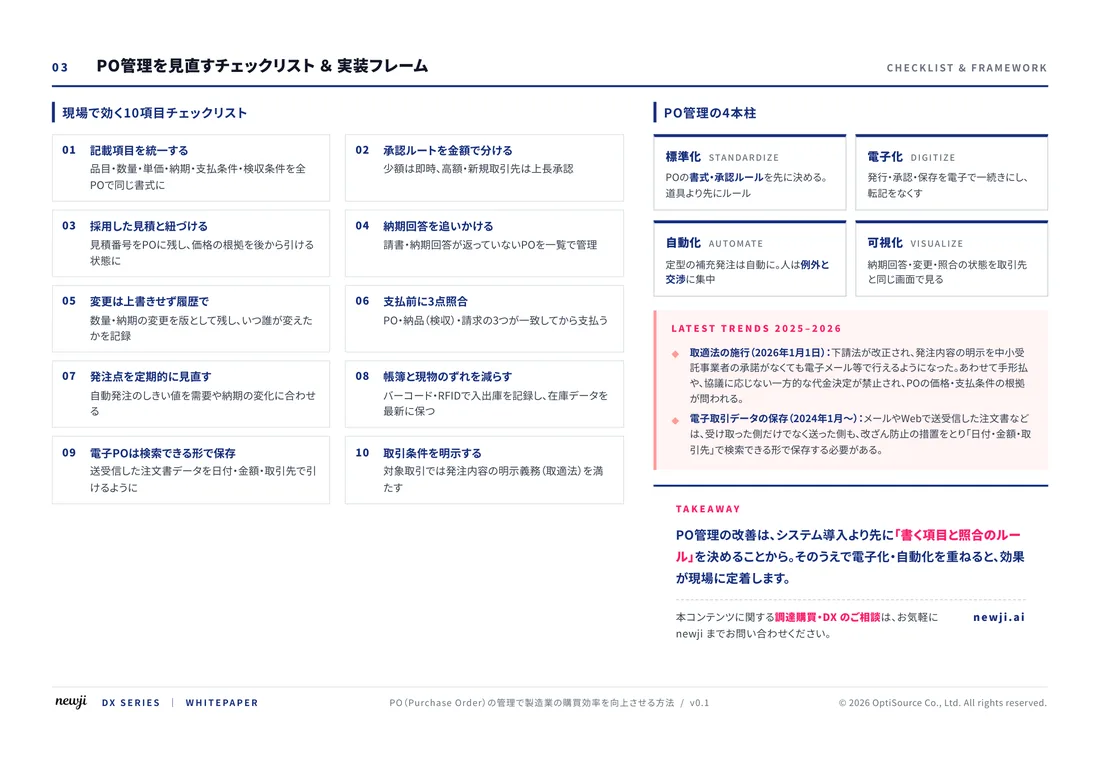
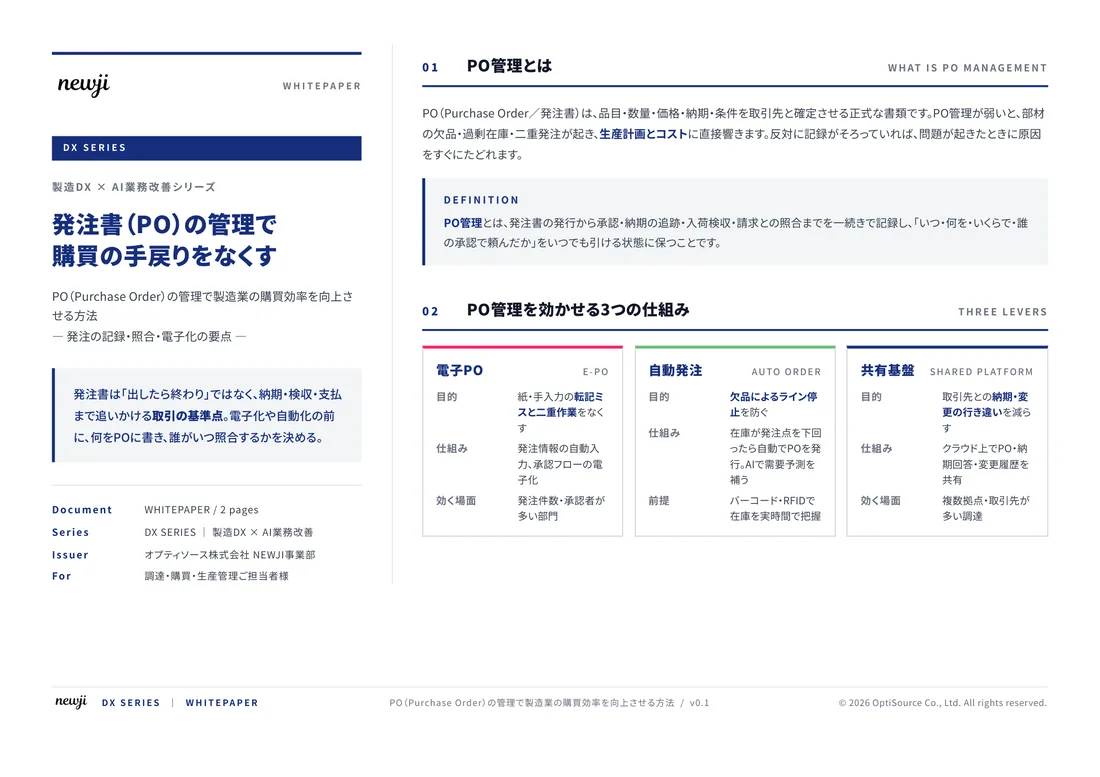
FREE DOCUMENT — サービス資料(PDF・無料)
製造業の見積・受発注クラウド
「Newji one」とは
Newji one は、製造業の調達・受発注に特化したクラウド/AIエージェント。見積依頼・発注書作成・進捗管理・承認をひとつの画面に集約し、AIが比較と異常検知を担当。最後の「GO」だけ人が押す仕組みです。
▶ 製造業の見積・受発注クラウド「Newji one」を、資料で見る(PDF・無料)
- 見積〜発注〜納期を一元管理。催促・転記のムダをゼロに
- AIが相見積もり比較と異常検知。あなたは判断だけに集中
- 取引先は「招待」で完全無料。自社コストだけで取引先ごとデジタル化
※ 取引先から招待された企業様は完全無料でご利用いただけます

 NEWJI総研
 OEM/ODM 生産委託
 AI/DX支援
 見積・発注クラウド Newji one
受発注が増えるほど、入力・確認・催促が重くなる。
受発注管理を“仕組み化“して、ミスと工数を削減しませんか。
見積・発注・納期まで一元管理できます。