

- お役立ち記事
- The pitfall of digital transformation: Too much visualized data that goes unused

スタートアップから大手まで。
調達・受発注をAIで標準化。
相見積比較も進捗管理もAIが下支え。取引先は招待で完全無料。

The pitfall of digital transformation: Too much visualized data that goes unused

目次
Understanding Digital Transformation and Data Visualization
Digital transformation has become a buzzword across industries, promising to revolutionize business operations and customer interactions.
At its core, digital transformation means integrating digital technologies into all areas of a business, leading to fundamental changes in how companies operate.
As part of this process, businesses strive to leverage data as a key asset.
Data visualization is a pivotal component of digital transformation.
It involves representing data in graphical formats, facilitating the understanding of complex datasets.
The idea is that by transforming patterns and trends within large volumes of data into visual formats, businesses can make more informed decisions.
However, there’s a growing concern that companies are producing too much visualized data that ultimately goes unused.
The Surge of Unused Data
Despite the advantages of data visualization, many organizations are overwhelmed by the sheer volume of data.
Every interaction, transaction, or event generates data, and modern businesses are capable of collecting more information than ever before.
This abundance of data leads to the creation of extensive graphs, charts, and dashboards.
The problem arises when these visualizations are abundant, yet underutilized.
Many businesses do not have the right strategies in place to effectively interpret and act on this data.
The lack of coherent analysis and utilization strategies results in wasted resources and missed opportunities for growth.
Why Data Goes Unused
There are several reasons why visualized data often goes unnoticed or unacted upon.
Lack of Focus
One of the main reasons is the lack of focus or alignment with business objectives.
Organizations may collect data without having a clear understanding of which datasets are most relevant to their goals.
Without a targeted approach, companies generate data for the sake of it, leading to cluttered dashboards that do not align with any specific business questions.
Inadequate Tools and Skills
Another significant obstacle is the lack of adequate tools and skills among employees.
While visualization tools are powerful, they require a certain level of expertise to extract meaningful insights.
If employees are not trained to use these tools effectively, data visualization efforts can become surface-level or misinterpreted.
Decision-Making Culture
The decision-making culture within an organization can also affect how data is used.
Some companies may still rely heavily on intuition or experience rather than integrating data-driven insights into their decision-making processes.
This cultural mindset limits the role of data and hinders its potential to drive change.
Information Overload
Lastly, information overload can be a significant barrier.
Even when there is valuable information to be gleaned, too much data can be overwhelming, making it difficult for decision-makers to focus on what truly matters.
Strategies for Effectively Using Data
To bridge the gap between data collection and data utilization, businesses should consider the following strategies:
Align Data with Business Objectives
Companies should start by defining clear business objectives and aligning their data collection and visualization efforts with these goals.
This ensures that any visualized data is directly tied to actionable insights that support strategic objectives.
Invest in Training
Training employees to use data visualization tools effectively is essential.
Organizations should invest in workshops and courses that empower staff with the necessary skills to interpret and act on data insights.
Cultivate a Data-Driven Culture
A cultural shift towards valuing data-driven decision-making can maximize the impact of data visualization.
Leadership can set the tone by incorporating data insights into strategy sessions and encouraging a culture of curiosity and continuous learning.
Prioritize and Simplify
Focusing on the most critical datasets and simplifying visualizations can mitigate the risk of information overload.
By prioritizing key metrics and avoiding unnecessary complexity, decision-makers can maintain clarity and focus on actionable insights.
The Future of Digital Transformation
As digital transformation continues to evolve, organizations must navigate the challenges of data visualization effectively.
While the amount of data generated will only increase, it’s crucial for companies to develop strategies that emphasize the utility of visualized data, rather than its quantity.
By aligning data efforts with business goals, fostering a data-driven culture, investing in skill development, and simplifying information, businesses can ensure that their digital transformation efforts lead to tangible benefits.
In doing so, they will not only avoid the pitfall of unused data but also position their organization for sustainable success in the digital age.
この記事の理解を深める
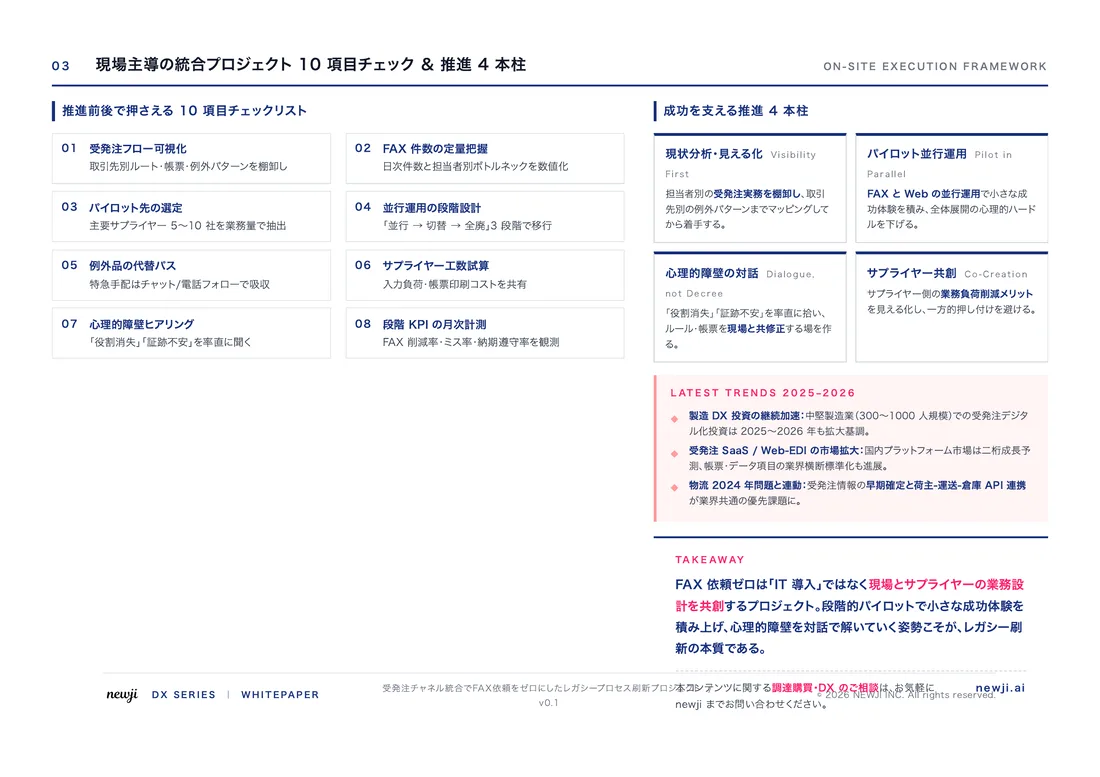
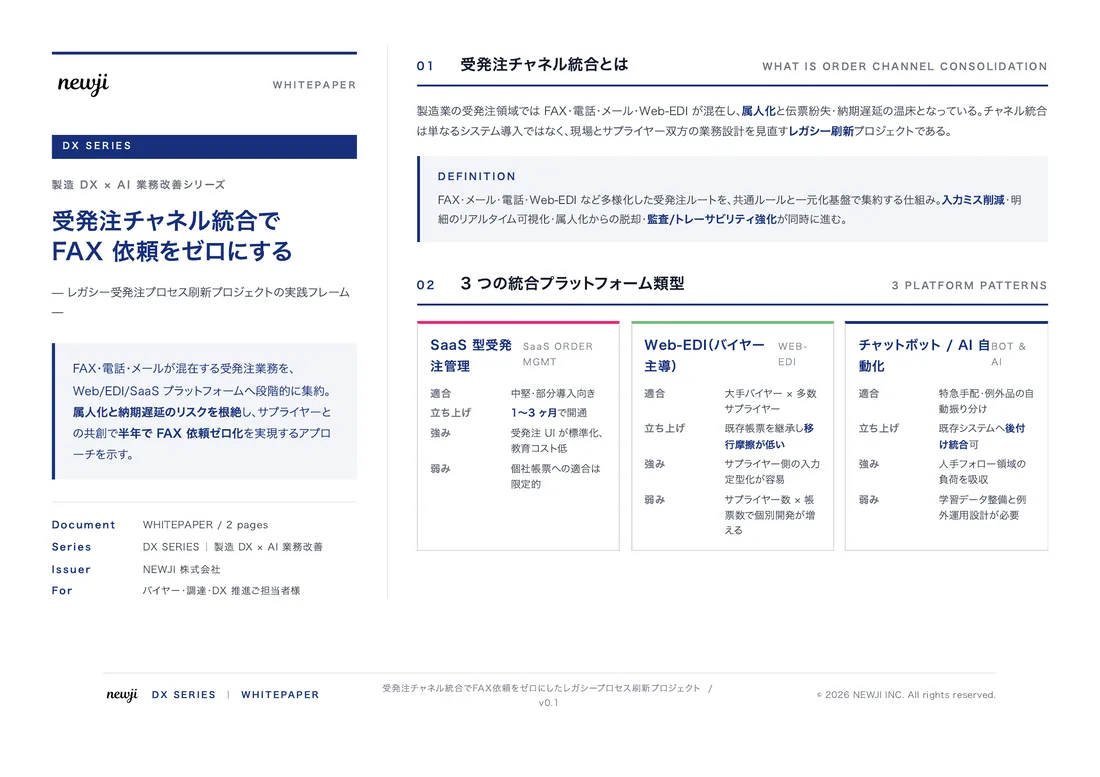
無料ホワイトペーパーをプレゼント
製造業の現場で使える実務資料(PDF)を無料でお届けします。"こんな資料が届きます" ↓ 下のボタンからどうぞ。
PRODUCT — 製造業向け 調達・受発注クラウド
この記事の課題、
newji で解決しませんか?
newji は、製造業の調達・受発注に特化したクラウド/AIエージェント。見積依頼・発注書作成・進捗管理・承認をひとつの画面に集約し、AIが比較と異常検知を担当。最後の「GO」だけ人が押す仕組みです。
- 見積〜発注〜納期を一元管理。催促・転記のムダをゼロに
- AIが相見積もり比較と異常検知。あなたは判断だけに集中
- 取引先は「招待」で完全無料。自社コストだけで取引先ごとデジタル化
※ 取引先から招待された企業様は完全無料でご利用いただけます


 調達購買アウトソーシング
 OEM/ODM 生産委託
 NEWJI DX
 受発注AIエージェント