

- お役立ち記事
- Metrics and analytical methods for measuring sales and marketing effectiveness in the manufacturing industry

その単価は妥当か。
AI が根拠付きで分析。
相見積の比較も発注も進捗管理も、ひとつの画面に。

Metrics and analytical methods for measuring sales and marketing effectiveness in the manufacturing industry

目次
Understanding Key Metrics in Manufacturing Sales and Marketing
In the manufacturing industry, measuring sales and marketing effectiveness is crucial.
Understanding key metrics helps businesses make informed decisions and optimize their strategies.
Whether you’re focusing on sales growth, customer acquisition costs, or return on investment, these metrics provide valuable insights.
Sales Growth
Sales growth is a fundamental metric that indicates the increase in sales over a specific period.
It helps businesses understand their market position and expansion.
To calculate sales growth, take the current sales revenue and subtract the previous period’s revenue.
Then, divide the resulting value by the previous period’s revenue and multiply by 100 to get the percentage growth.
For instance, if your sales grew from $1 million to $1.2 million, the growth rate is 20%.
Customer Acquisition Cost (CAC)
The Customer Acquisition Cost (CAC) measures how much a company spends to acquire a new customer.
It is calculated by dividing the total sales and marketing expenses by the number of new customers acquired during a specific period.
Lowering the CAC can significantly enhance profitability.
For example, if your business spent $100,000 on marketing efforts and acquired 200 new customers, the CAC is $500.
Return on Investment (ROI)
Return on Investment (ROI) is a critical metric that evaluates the efficiency of an investment.
It measures the gains achieved relative to the investment cost.
To calculate ROI, subtract the initial investment from the final return, divide this number by the initial investment, and multiply by 100 to express it as a percentage.
If you invested $50,000 in a marketing campaign and earned $200,000 as a result, the ROI would be 300%.
Analyzing Sales Pipeline
Examining the sales pipeline involves tracking prospects through various stages, from initial contact to final purchase.
This analysis helps identify bottlenecks and areas for improvement.
Lead Conversion Rate
The lead conversion rate measures the percentage of leads that turn into paying customers.
It is calculated by dividing the number of new customers by the total number of leads and multiplying by 100.
A higher conversion rate indicates effective sales and marketing strategies.
If you generate 1,000 leads and convert 150 into customers, your conversion rate is 15%.
Sales Cycle Length
Sales cycle length refers to the time it takes to convert a lead into a customer.
Shorter sales cycles often indicate a streamlined and efficient process.
Tracking the duration from initial contact to sale helps businesses identify areas for acceleration.
Advanced Analytical Methods
Beyond basic metrics, more advanced analytical methods provide deeper insights.
These include predictive analytics, customer segmentation, and lifetime value analysis.
Predictive Analytics
Predictive analytics involves using historical data to forecast future trends.
In sales and marketing, it helps identify which leads are most likely to convert.
By analyzing patterns and behaviors, businesses can tailor their strategies to target high-potential prospects.
Customer Segmentation
Customer segmentation divides the customer base into distinct groups based on characteristics such as demographics, buying behavior, and preferences.
Analyzing these segments allows businesses to create targeted marketing campaigns.
For instance, segmenting by purchase history can help identify loyal customers and promote higher-value products.
Customer Lifetime Value (CLV)
Customer Lifetime Value (CLV) measures the total revenue a business can expect from a customer throughout their relationship.
It is calculated by multiplying the average purchase value by the number of purchases per year and the average customer lifespan.
Understanding CLV helps businesses focus on retaining high-value customers and improving long-term profitability.
Integrating Technology
Leveraging technology is essential for accurate measurement and analysis.
Tools like Customer Relationship Management (CRM) systems and marketing automation platforms streamline data collection and provide comprehensive insights.
CRM Systems
CRM systems manage interactions with current and potential customers.
They store customer data, track sales, and monitor customer relationships.
Using CRM, businesses can identify sales opportunities, track communication, and analyze customer preferences.
Marketing Automation
Marketing automation platforms streamline repetitive tasks such as email campaigns, social media posts, and lead nurturing.
These tools provide valuable data on customer behavior and campaign performance.
By automating processes, businesses can focus on analyzing results and optimizing strategies.
Continuous Monitoring and Improvement
Measuring sales and marketing effectiveness is an ongoing process.
Regularly monitoring key metrics and analyzing data helps businesses adapt to changing market conditions.
Setting Benchmarks
Establishing benchmarks allows businesses to compare current performance with past results and industry standards.
Benchmarks set goals and highlight areas needing improvement.
A/B Testing
A/B testing involves comparing two versions of a marketing element to determine which performs better.
This method helps optimize marketing strategies by testing variables like headlines, images, and call-to-action buttons.
Feedback Loops
Feedback loops involve collecting customer feedback and using it to improve products, services, and marketing strategies.
Surveys, reviews, and direct communication provide valuable insights into customer satisfaction and preferences.
In conclusion, measuring sales and marketing effectiveness in the manufacturing industry involves understanding key metrics, analyzing the sales pipeline, employing advanced analytical methods, integrating technology, and continuously monitoring performance.
By focusing on these areas, businesses can make data-driven decisions and achieve sustainable growth.
この記事の理解を深める
無料ホワイトペーパーをプレゼント
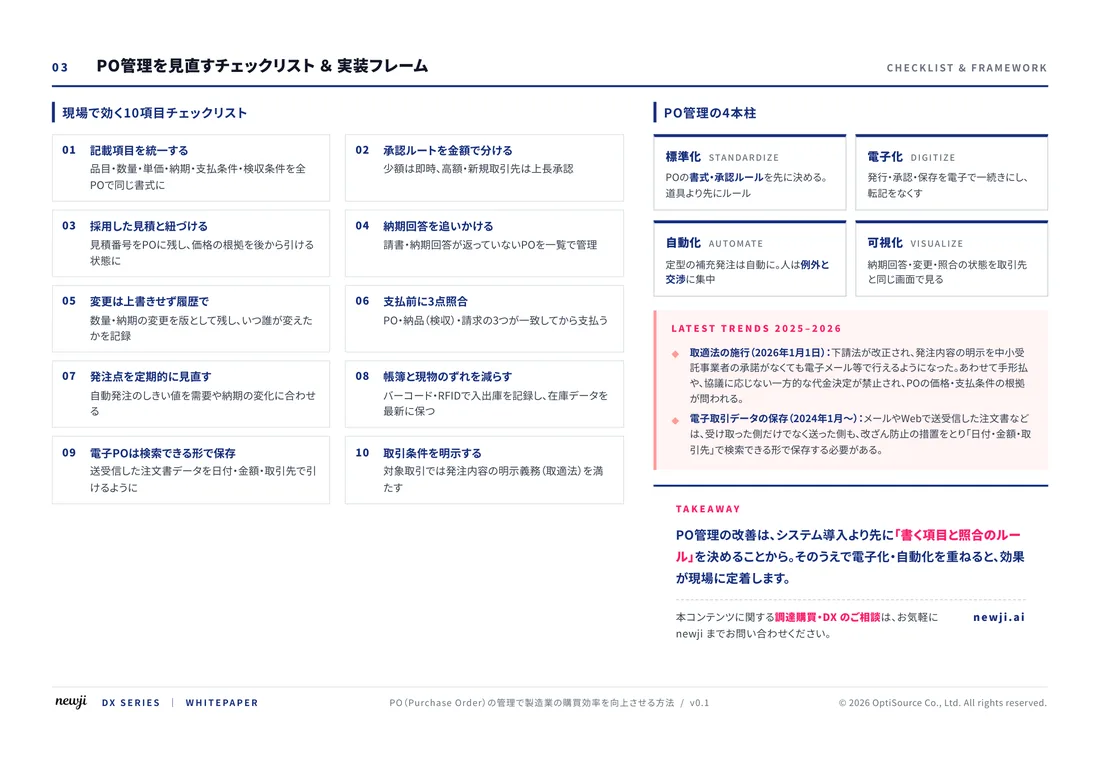
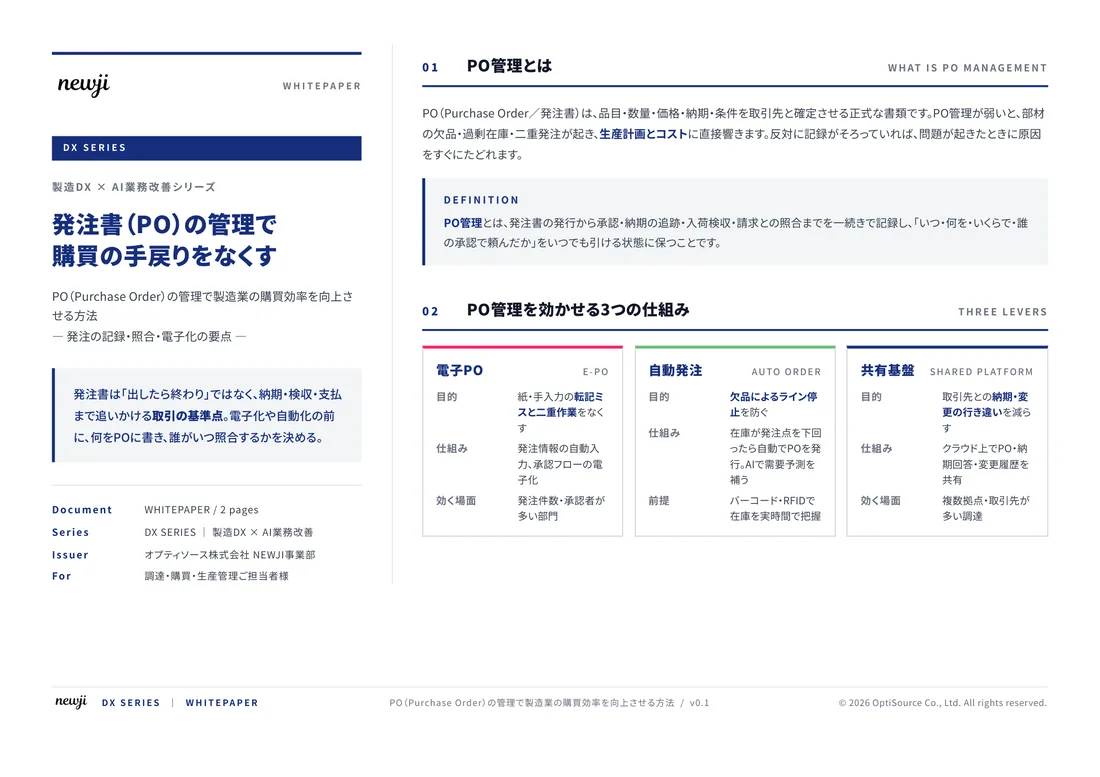
製造業の現場で使える実務資料(PDF)を無料でお届けします。"こんな資料が届きます" ↓ 下のボタンからどうぞ。
FREE DOCUMENT — サービス資料(PDF・無料)
製造業の見積・受発注クラウド
「Newji one」とは
Newji one は、製造業の調達・受発注に特化したクラウド/AIエージェント。見積依頼・発注書作成・進捗管理・承認をひとつの画面に集約し、AIが比較と異常検知を担当。最後の「GO」だけ人が押す仕組みです。
▶ 製造業の見積・受発注クラウド「Newji one」を、資料で見る(PDF・無料)
- 見積〜発注〜納期を一元管理。催促・転記のムダをゼロに
- AIが相見積もり比較と異常検知。あなたは判断だけに集中
- 取引先は「招待」で完全無料。自社コストだけで取引先ごとデジタル化
※ 取引先から招待された企業様は完全無料でご利用いただけます

 NEWJI総研
 OEM/ODM 生産委託
 AI/DX支援
 見積・発注クラウド Newji one
受発注が増えるほど、入力・確認・催促が重くなる。
受発注管理を“仕組み化“して、ミスと工数を削減しませんか。
見積・発注・納期まで一元管理できます。