

- お役立ち記事
- Quantitative quality improvement method using metrics in software development and its key points

その単価は妥当か。
AI が根拠付きで分析。
相見積の比較も発注も進捗管理も、ひとつの画面に。

Quantitative quality improvement method using metrics in software development and its key points

目次
Introduction to Quantitative Quality Improvement
In the world of software development, ensuring high-quality products is essential.
Quantitative quality improvement methods focus on using measurable data to enhance the quality of software.
This approach relies heavily on metrics that provide valuable insights into different aspects of the software development lifecycle.
By leveraging these metrics, developers and managers can make informed decisions to optimize processes, improve product quality, and increase customer satisfaction.
Understanding Metrics in Software Development
Metrics are measurable parameters used to assess the quality, performance, productivity, and efficiency of software development processes.
They offer a data-driven perspective into various aspects of development, helping teams identify areas needing improvement.
There are several types of metrics used in software development:
Code Quality Metrics
Code quality is crucial for the smooth functioning and maintenance of a software product.
Metrics in this category include code complexity, code duplications, and the number of defects.
– **Code Complexity**: This metric measures how complicated a codebase is.
High complexity often makes maintenance and debugging difficult.
Tools like cyclomatic complexity help gauge this aspect.
– **Code Duplications**: Repeated code fragments can lead to maintenance challenges.
Measuring code duplications helps identify unnecessary redundancies.
– **Number of Defects**: This measures how many bugs or errors exist in the software.
A higher number of defects often indicates poor code quality and can negatively impact user satisfaction.
Productivity Metrics
These metrics assess how efficiently a development team operates over a set period.
Common productivity metrics include velocity, cycle time, and lead time.
– **Velocity**: It measures the amount of work a team completes in a sprint.
A stable or increasing velocity indicates consistent productivity.
– **Cycle Time**: This is the duration between the beginning of a work item and its completion.
A shorter cycle time generally indicates an efficient development process.
– **Lead Time**: This measures the time from a new request until it is fulfilled.
Reducing lead time through efficient processes can lead to quicker delivery.
Testing Metrics
Testing metrics evaluate the effectiveness and efficiency of the testing phases in software development.
– **Test Coverage**: Indicates the percentage of code covered by tests.
Higher test coverage often correlates with higher-quality software.
– **Defect Density**: Measures the number of defects found in a unit of code.
Lower defect density suggests more robust software.
– **Test Case Effectiveness**: Examines whether test cases identify and prevent bugs.
Implementing a Quality Improvement Plan
A systematic approach to quality improvement starts with planning.
Define clear goals that align with overall project objectives.
Use metrics to make your objectives specific and measurable.
Data Collection and Analysis
Gather data consistently using standardized processes to ensure reliability and accuracy.
Once collected, analyze the data to establish baselines and identify trends or patterns over time.
Tools like dashboards and reports are advantageous for visualizing this data.
Identifying Areas for Improvement
With analyzed data, you can identify areas needing improvement.
This might mean refactoring complex code, addressing defects, or optimizing test cases.
Focus on areas with significant positive impacts when improved.
Setting Improvement Thresholds
Establish thresholds or targets for each metric.
These are specific values you wish to achieve or surpass, guiding your development and highlighting when corrective actions are necessary.
For example, if your defect density target is 1 defect per 1000 lines of code, falling above this prompts a deeper investigation.
Continuous Monitoring
Quality improvement is not a one-time effort.
It requires ongoing monitoring and adjustment as projects evolve and new challenges arise.
Regularly review metrics to ensure the improvement plan remains effective.
Continuously update thresholds and goals based on current data.
Challenges in Quantitative Quality Improvement
Implementing a quantitative quality improvement approach isn’t without its challenges.
One primary concern is the over-reliance on numbers.
Metrics can provide an incomplete story if not interpreted carefully.
For example, a high test coverage percentage doesn’t always equate to quality if the tests are of poor quality.
Additionally, focusing solely on metric goals might lead to undesirable practices, such as prioritizing quantity over quality of work.
Another challenge is data accuracy and consistency.
Ensuring that data collection methods are standardized and reliable is crucial, as any discrepancy can lead to misleading conclusions.
Finally, there’s the challenge of change management within the team.
It requires sustained effort to embrace metric-driven quality improvement fully.
Change resistance is common.
It takes clear communication and involvement from all team members to succeed.
Conclusion
Quantitative quality improvement in software development offers a structured, data-driven approach to enhance product quality.
By using metrics effectively, teams can identify weaknesses, measure progress, and achieve superior development outcomes.
While challenges exist, proper implementation practices, ongoing monitoring, and adjustments can lead to significant improvements.
Ultimately, this method aims to produce high-quality software that satisfies customer needs and enhances user experience.
この記事の理解を深める
無料ホワイトペーパーをプレゼント
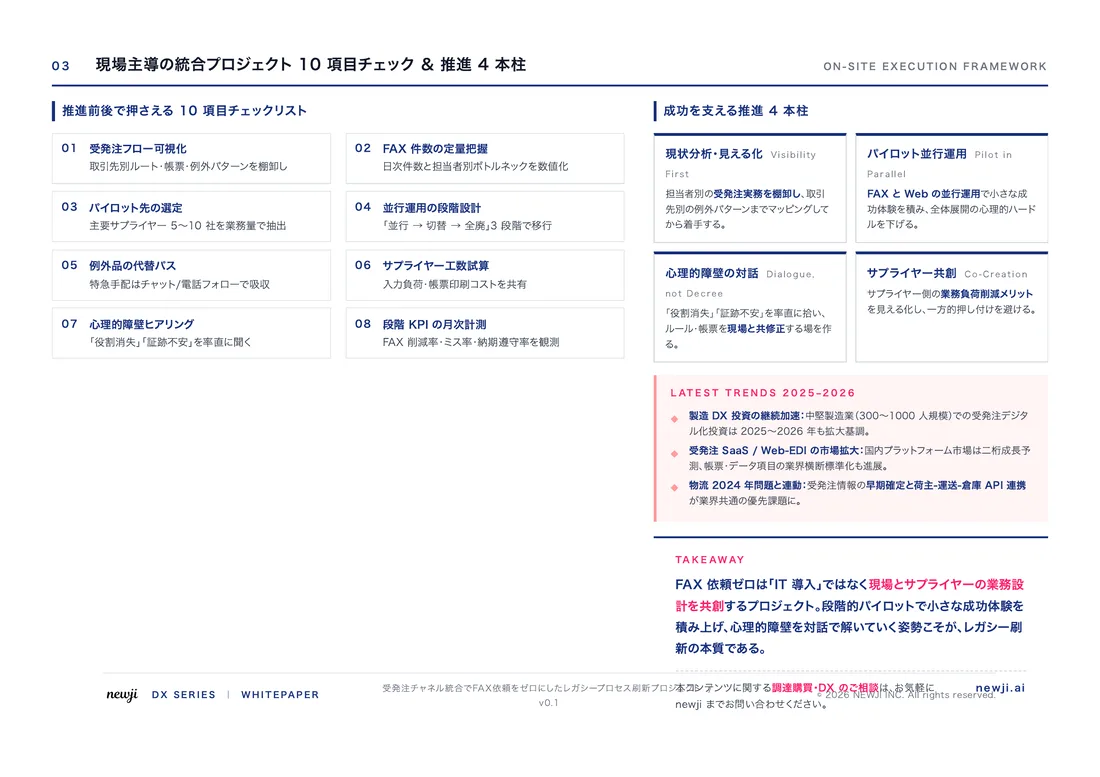
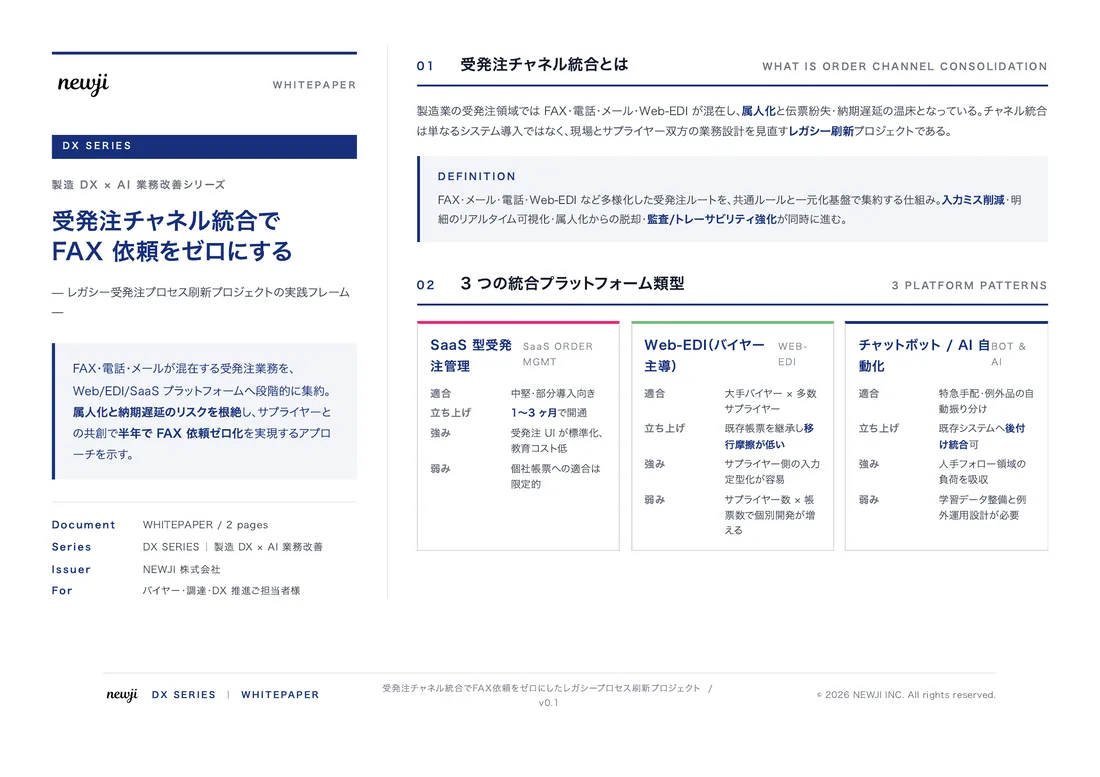
製造業の現場で使える実務資料(PDF)を無料でお届けします。"こんな資料が届きます" ↓ 下のボタンからどうぞ。
FREE DOCUMENT — サービス資料(PDF・無料)
製造業の見積・受発注クラウド
「Newji one」とは
Newji one は、製造業の調達・受発注に特化したクラウド/AIエージェント。見積依頼・発注書作成・進捗管理・承認をひとつの画面に集約し、AIが比較と異常検知を担当。最後の「GO」だけ人が押す仕組みです。
▶ 製造業の見積・受発注クラウド「Newji one」を、資料で見る(PDF・無料)
- 見積〜発注〜納期を一元管理。催促・転記のムダをゼロに
- AIが相見積もり比較と異常検知。あなたは判断だけに集中
- 取引先は「招待」で完全無料。自社コストだけで取引先ごとデジタル化
※ 取引先から招待された企業様は完全無料でご利用いただけます

 NEWJI総研
 OEM/ODM 生産委託
 AI/DX支援
 見積・発注クラウド Newji one
受発注が増えるほど、入力・確認・催促が重くなる。
受発注管理を“仕組み化“して、ミスと工数を削減しませんか。
見積・発注・納期まで一元管理できます。