

- お役立ち記事
- Learn the basics of multilevel models with R and their application to analysis

スタートアップから大手まで。
調達・受発注をAIで標準化。
相見積比較も進捗管理もAIが下支え。取引先は招待で完全無料。

Learn the basics of multilevel models with R and their application to analysis

目次
Understanding Multilevel Models
Multilevel models, also known as hierarchical linear models, are statistical methods that accommodate data structured at more than one level.
These models are quite useful when dealing with research problems where the data involves multiple grouped levels.
For example, in educational research, students are often nested within classrooms, and classrooms are nested within schools.
In such cases, multilevel models can provide more accurate insights than traditional statistical methods.
Multilevel models allow for the analysis of data with varied and complex structures.
They can manage the variability at each level, providing more nuanced and accurate results.
By understanding the dependency in the data, these models help researchers uncover patterns and relationships that might remain hidden otherwise.
Why Use Multilevel Models?
The primary advantage of multilevel models is their ability to handle hierarchically structured data.
Traditional regression methods may fail to account for the non-independence of data within groups, leading to biased or incorrect results.
Multilevel models, on the other hand, explicitly consider the correlation within clusters or groups, resulting in more reliable and valid findings.
These models also allow for the inclusion of group-level predictors in addition to individual-level predictors.
This flexibility enables researchers to explore how group-level characteristics might influence individual outcomes.
Furthermore, multilevel models accommodate the analysis of data with varied and complex structures, such as longitudinal data and clustered data, by allowing for random effects and fixed effects.
Getting Started with R for Multilevel Models
R is a powerful and versatile tool for statistical analysis, including multilevel modeling.
To get started, first ensure that R and RStudio are installed on your computer.
You’ll also need to install specific packages that facilitate multilevel modeling analyses, such as `lme4` and `nlme`.
“`R
install.packages(“lme4”)
install.packages(“nlme”)
“`
These packages offer functions that help model hierarchical structures in your data.
The `lme4` package is commonly used for fitting linear and generalized linear mixed-effects models, while the `nlme` package provides similar functionality, with additional options for complex data structures.
Loading and Preparing Your Data
Once your packages are installed, you need to load your data into R.
R can handle various data formats, but most often, you’ll work with data frames.
Use functions such as `read.csv()` or `read.table()` to import your dataset.
“`R
data <- read.csv("yourdatafile.csv")
```
After loading your data, it's crucial to examine it and prepare it for analysis.
Check for missing values, outliers, and make sure your variables are correctly typed.
Factorize categorical variables to ensure they're treated appropriately in the model.
Fitting a Multilevel Model
Now that your data is ready, you can fit a multilevel model.
The `lme4` package allows you to easily define fixed and random effects using the `lmer()` function.
Here’s an example syntax for fitting a basic multilevel model with two levels:
“`R
library(lme4)
model <- lmer(response_variable ~ fixed_factor1 + fixed_factor2 + (1 | random_factor), data = data)
```
In this example, `response_variable` is your dependent variable, `fixed_factor1` and `fixed_factor2` are fixed effects (predictors), and `random_factor` represents the higher-level grouping variable such as schools or classes.
Analyzing Model Output
Once your model is fitted, it’s vital to interpret the results.
Use the `summary()` function to extract detailed information about the model’s fit and the significance of each predictor.
“`R
summary(model)
“`
The output will include estimates of fixed effects, variances of random effects, and the overall fit of the model.
Pay close attention to the fixed effects’ estimates and their significance levels as they inform the relationship between predictors and the response variable.
Checking Model Assumptions
Validating the assumptions underlying your multilevel model is vital to ensure the robustness of your findings.
Common checks include examining residual plots to assess the normality and homoscedasticity of residuals, and checking for potential multicollinearity issues among predictors.
Use diagnostic plots like `plot()` and `qqnorm()` to visually assess these assumptions.
“`R
plot(model)
qqnorm(resid(model))
qqline(resid(model))
“`
If the assumptions are violated, consider transforming your data or switching to a more appropriate model specification.
Applying Multilevel Models in Real-World Analysis
Multilevel models are widely applied in numerous fields, from education to healthcare, social sciences, and marketing.
Understanding and correctly applying these models can unveil insights that are crucial for decision-making and strategy.
For example, in a study examining the impact of teaching methods, a multilevel model can account for variations within and between schools, offering a clearer understanding of the factors influencing student performance.
These models are also crucial in clinical studies, where measurements might be repeated over time or patients nested within different clinics.
Conclusion
Mastering multilevel models with R equips researchers and analysts with potent tools to explore hierarchically structured data.
While the initial learning curve can be steep, the ability to derive deeper insights from complex datasets is invaluable.
By using R and appropriate packages, you can harness multilevel modeling to produce robust, high-quality analyses, leading to more informed decisions and understanding of the phenomena under study.
この記事の理解を深める
無料ホワイトペーパーをプレゼント
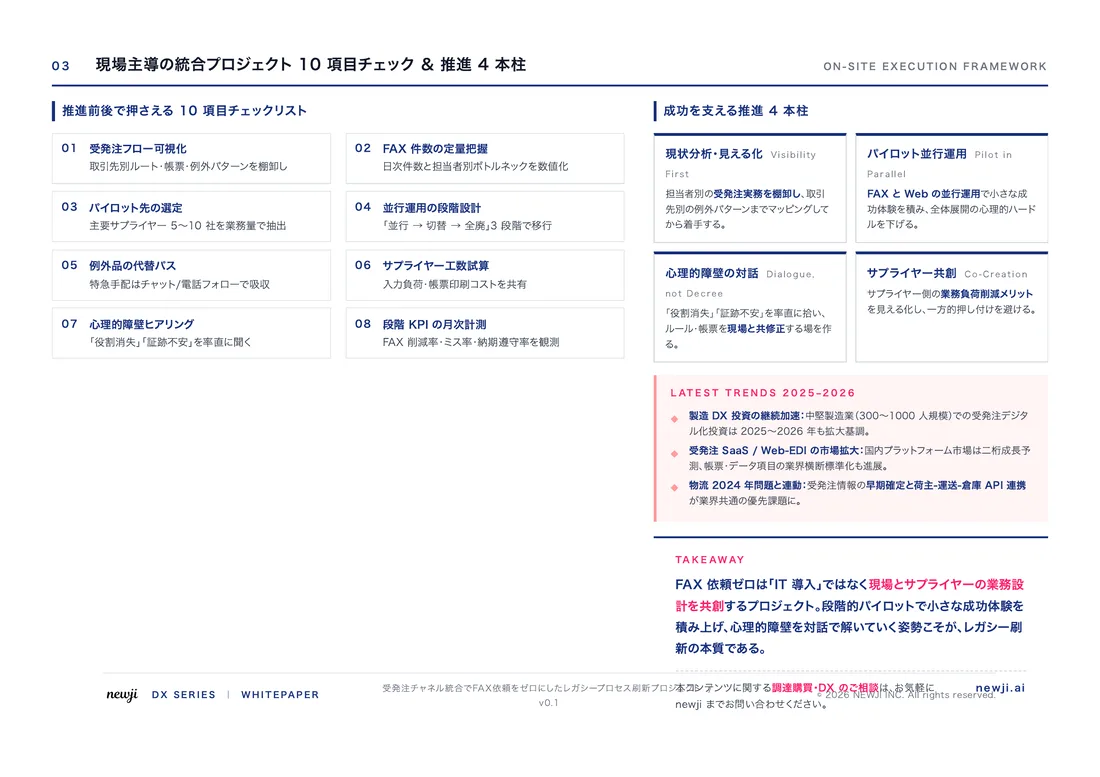
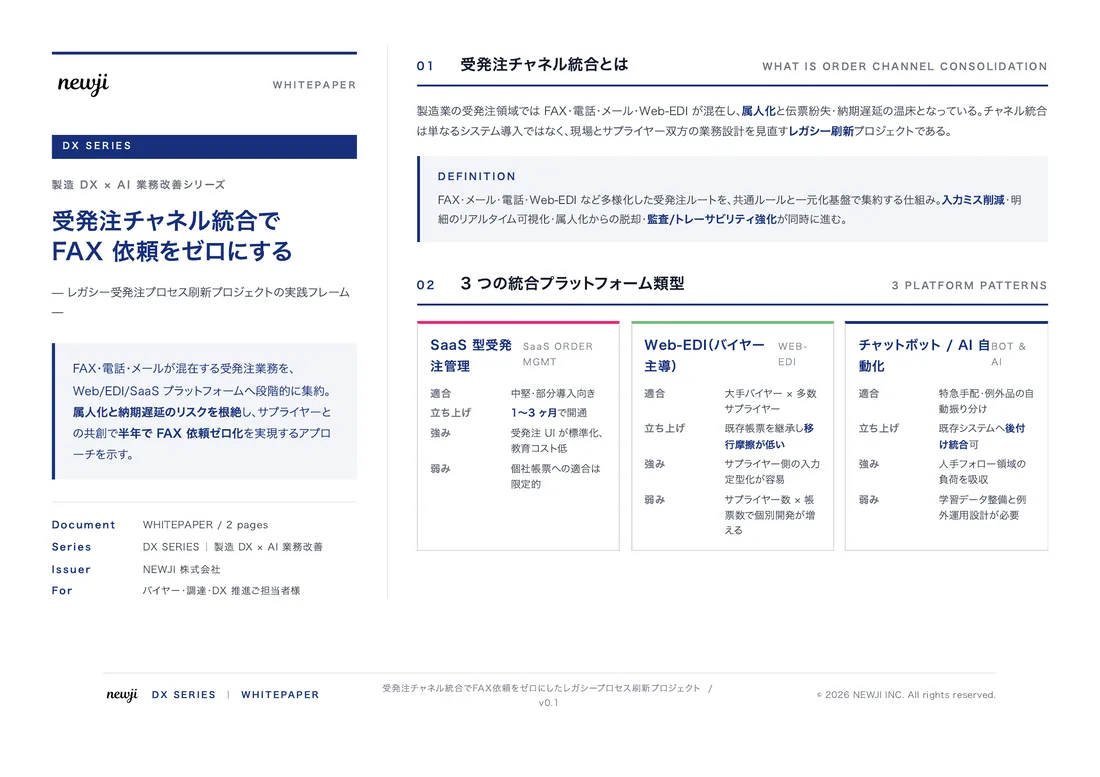
製造業の現場で使える実務資料(PDF)を無料でお届けします。"こんな資料が届きます" ↓ 下のボタンからどうぞ。
PRODUCT — 製造業向け 調達・受発注クラウド
この記事の課題、
newji で解決しませんか?
newji は、製造業の調達・受発注に特化したクラウド/AIエージェント。見積依頼・発注書作成・進捗管理・承認をひとつの画面に集約し、AIが比較と異常検知を担当。最後の「GO」だけ人が押す仕組みです。
- 見積〜発注〜納期を一元管理。催促・転記のムダをゼロに
- AIが相見積もり比較と異常検知。あなたは判断だけに集中
- 取引先は「招待」で完全無料。自社コストだけで取引先ごとデジタル化
※ 取引先から招待された企業様は完全無料でご利用いただけます


 調達購買アウトソーシング
 OEM/ODM 生産委託
 NEWJI DX
 受発注AIエージェント