

- お役立ち記事
- Fundamentals of time series data analysis and application methods for anomaly detection and change point detection

スタートアップから大手まで。
調達・受発注をAIで標準化。
相見積比較も進捗管理もAIが下支え。取引先は招待で完全無料。

Fundamentals of time series data analysis and application methods for anomaly detection and change point detection

目次
Understanding Time Series Data
Time series data is a collection of observations recorded over time, typically at uniform intervals.
These data sets are used in various fields like finance, economics, environmental science, and engineering to analyze trends, make predictions, and make informed decisions.
One of the key features of time series data is its sequential nature, meaning that the order of data points matters.
Each data point is time-stamped, allowing analysts to observe trends, cycles, and seasonal variations.
Common examples include stock prices, weather records, and even daily sales in retail.
Components of Time Series Data
When working with time series data, it is crucial to understand its various components.
These components help in analyzing and making sense of the data.
Trend
The trend represents the long-term movement in a time series.
It shows the general direction in which data is moving—either upward, downward, or constant.
Identifying the trend component is essential because it provides an overarching view of the data and its patterns over time.
Seasonality
Seasonality refers to patterns that repeat regularly over specific intervals due to external influences like climate or cultural events.
For instance, retail sales often increase during holiday seasons.
Recognizing these patterns is crucial for making short-term forecasts and planning operations around expected variations.
Cyclical Component
The cyclical component reflects fluctuations in the time series data that are not of fixed frequency, unlike seasonality.
These are often tied to economic cycles and can span multiple years.
Understanding cyclical patterns helps in assessing the economic conditions and making strategic decisions.
Irregular Component
This component accounts for random or unforeseen events that cannot be attributed to trends, seasonal, or cyclical influences.
It includes sudden events like natural disasters or unexpected occurrences impacting the data, which are usually unpredictable and temporary.
Analyzing Time Series Data
Time series analysis involves evaluating the data to uncover meaningful insights and patterns.
Several techniques are employed to achieve this.
Visualization
Visualizing time series data with line charts or scatter plots is one of the most effective ways to understand its behavior over time.
These visuals help in identifying trends, detecting anomalies, and recognizing seasonal patterns.
Decomposition
Decomposition involves breaking down time series data into its constituent components: trend, seasonality, and random (irregular) elements.
This technique aids in better understanding the underlying structure of the data and making accurate predictions.
Moving Averages
A moving average smooths out short-term fluctuations and highlights longer-term trends.
By averaging a set number of data points, this technique helps reduce noise and provides a clearer picture of the overall trend.
Autocorrelation
Autocorrelation measures the correlation between current and past values in a time series.
It helps in understanding the degree of relationship within the data, essential for building predictive models and identifying cycles.
Anomaly Detection in Time Series Data
Anomaly detection is about identifying data points that deviate significantly from the expected pattern or behavior.
These anomalies can indicate errors, fraudulent activities, or significant changes requiring attention.
Statistical Methods
Statistical approaches, such as the z-score method, are commonly used for anomaly detection.
This method involves calculating the standard deviation and identifying data points that fall outside the defined threshold, typically set at three standard deviations from the mean.
Machine Learning Techniques
Machine learning has opened new avenues for anomaly detection by leveraging models that learn the data pattern over time.
Techniques like isolation forests, support vector machines, and neural networks can detect complex anomalies with high accuracy.
Threshold-Based Methods
Threshold-based methods set fixed or dynamic boundaries beyond which a data point is considered an anomaly.
These thresholds can be predetermined based on historical data or adaptively learned using statistical or machine learning models.
Use Cases
Anomaly detection has vital applications across various industries, such as identifying fraudulent transactions in finance, spotting equipment malfunctions in manufacturing, and detecting network intrusions in cybersecurity.
Change Point Detection in Time Series
Change point detection involves identifying shifts or transitions in the behavior of time series data.
These changes can occur in mean, variance, or structure, necessitating timely recognition and response.
Importance of Change Point Detection
Detecting change points is crucial for organizations as it helps them adapt strategies and respond to changes effectively.
It also aids in understanding the root causes of changes in data patterns, thus informing better decision-making.
Methods for Change Point Detection
Several methods exist for performing change point detection.
Statistical Approaches
Statistical methods for change point detection include the Cumulative Sum Control Chart (CUSUM) and Autoregressive Integrated Moving Average (ARIMA).
These approaches analyze the data’s statistical properties to identify structural breaks.
Bayesian Methods
Bayesian methods use probabilistic models to detect change points by estimating the likelihood of transitions.
These methods provide a dynamic and flexible approach, accommodating multiple change points and incorporating prior knowledge into the analysis.
Machine Learning Approaches
Machine learning models, such as clustering techniques and neural networks, have been developed to tackle change point detection challenges.
These models can uncover intricate patterns and pinpoint changes more accurately than traditional methods.
Real-World Applications
Change point detection is beneficial in diverse sectors, such as monitoring shifts in customer behavior in marketing, detecting disruptions in supply chains, and identifying environmental changes for disaster preparedness.
Conclusion
Time series data analysis is a powerful tool that enables organizations to comprehend past behaviors, anticipate future trends, and identify anomalies and change points effectively.
By understanding the components and employing appropriate techniques, businesses can leverage time series analysis for strategic insights and competitive advantage.
Both anomaly detection and change point detection provide valuable information that facilitates proactive decision-making and enhances operational efficiency.
この記事の理解を深める
無料ホワイトペーパーをプレゼント
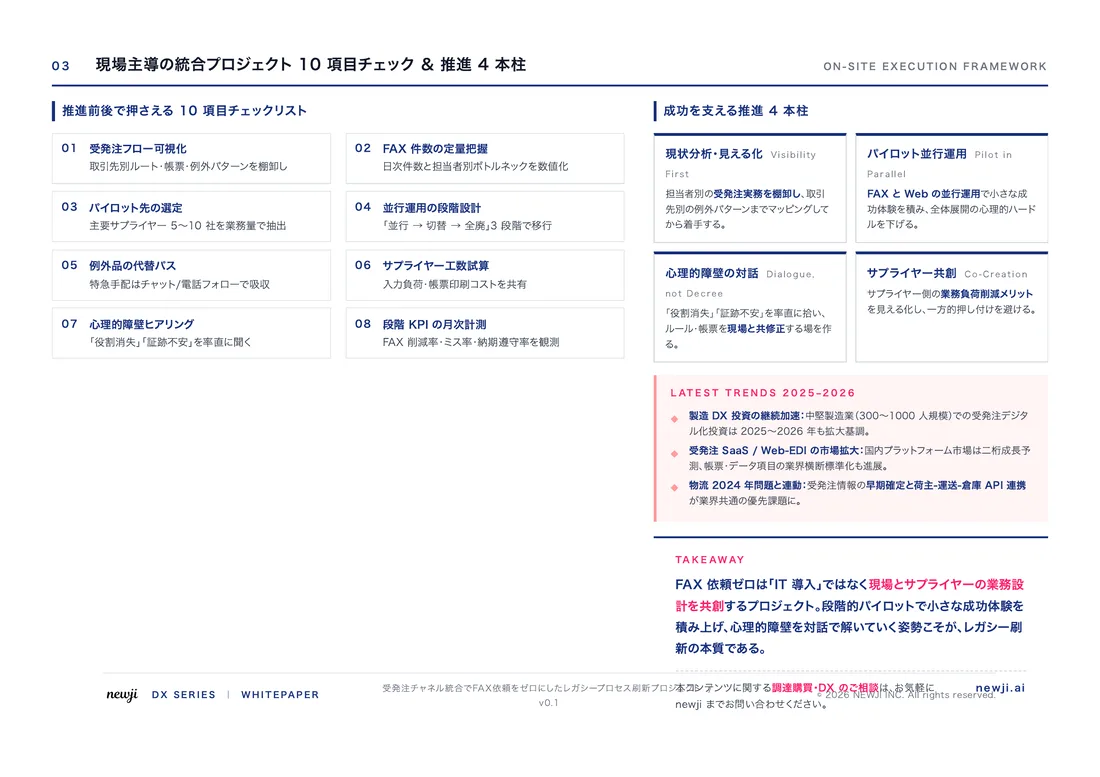
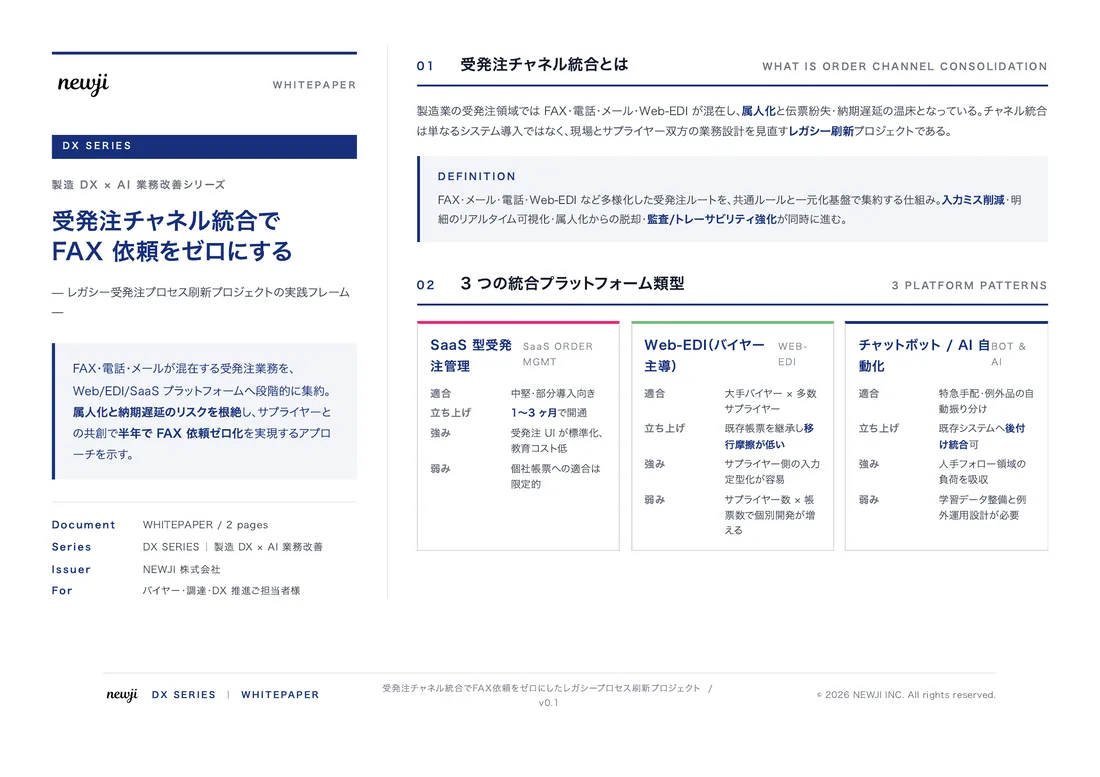
製造業の現場で使える実務資料(PDF)を無料でお届けします。"こんな資料が届きます" ↓ 下のボタンからどうぞ。
PRODUCT — 製造業向け 調達・受発注クラウド
この記事の課題、
newji で解決しませんか?
newji は、製造業の調達・受発注に特化したクラウド/AIエージェント。見積依頼・発注書作成・進捗管理・承認をひとつの画面に集約し、AIが比較と異常検知を担当。最後の「GO」だけ人が押す仕組みです。
- 見積〜発注〜納期を一元管理。催促・転記のムダをゼロに
- AIが相見積もり比較と異常検知。あなたは判断だけに集中
- 取引先は「招待」で完全無料。自社コストだけで取引先ごとデジタル化
※ 取引先から招待された企業様は完全無料でご利用いただけます


 調達購買アウトソーシング
 OEM/ODM 生産委託
 NEWJI DX
 受発注AIエージェント